
MONTHLY FINANCIAL MARKET UPDATE
The summary below is provided for educational purposes only. If you have any thoughts or would like to discuss any other matters, please feel free to contact me.
A Tale of Two Cities
The first quarter of 2018 can be placed into two distinctive camps. Market action in January was a continuation of 2017, with investors pricing in sharp upward revisions to 2018 profit estimates (Thomson Reuters). But the tide shifted in February and March, with volatility replacing relative tranquility.
Did you know the S&P 500 Index snapped its longest streak without a back-to-back daily 0.5% decline at the end of January? That’s right – 310 trading days without two consecutive pullbacks of at least 0.5%, according to the research firm Bespoke Group. It was nearly double the prior streak.
The lack of volatility, which can create complacency, was nearly unprecedented. Yes, volatility sometimes leads to uneasiness. I get it. We take various precautions to reduce risk, but the return required to reach your financial goals requires some risk, or what might be called a calculated risk.
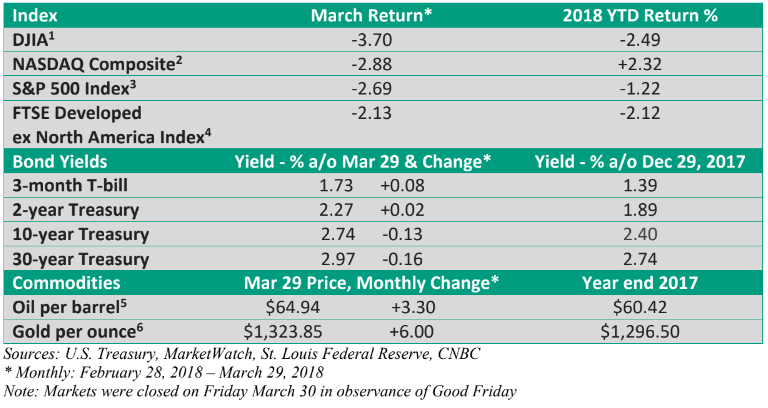
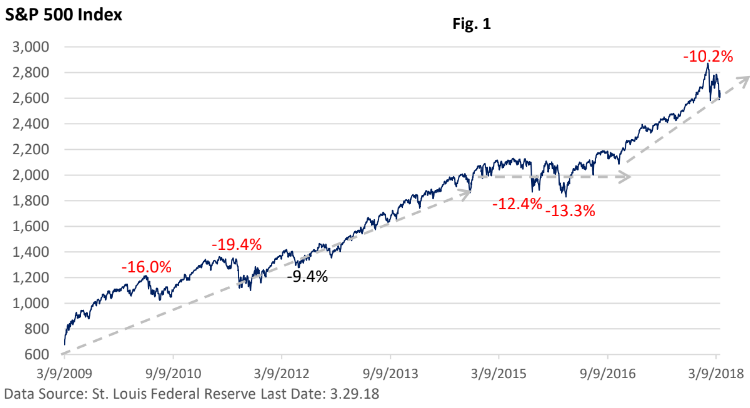
Figure 1 highlights the path of the broad-based S&P 500 Index since the bull market began. It has been a profitable trend for a diversified investor, but one that has included five market corrections of at least 10%.
That 10% pullback from the record-closing peak on January 26 took just nine trading days, the shortest such peak to 10% correction on record (LPL Research) – see Figure 1.
The initial selloff was sparked by a rise in the yield on the 10-year Treasury bond. The drop was exacerbated by investment products tied to market volatility. Without getting into all the minutia, too many speculators piled into a trade that bet the lack of market volatility would continue.
When stocks swooned in early February, the unwinding of the “volatility trade” aggravated what likely would have been a very modest decline. That trade eventually unwound, but we were treated to another round of instability when President Donald Trump surprised investors by announcing steep tariffs on steel and aluminum imports – tariffs designed to pry open foreign markets to U.S. goods.
Protectionism has always been a risk that could create instability, as Trump had campaigned on the issue. New barriers to imports had been placed on the backburner in 2017. That has changed.
The reason for worries—steel and aluminum tariffs raise U.S. manufacturing costs, hinder new projects, and may encourage some firms to move production offshore. Newly erected barriers can also spark a tit-for-tat trade war as other countries retaliate against U.S. exports, slowing economic and profit growth.
It’s a scenario that creates heightened uncertainty and has added to the volatile daily market swings.
The ebb and flow of risk
Stocks have a long-term upward bias that will be interrupted from time to time by various issues.
Early in the economic recovery, investors fretted about Greece, the expanding debt crisis in Europe, and the loss of the USA’s triple-A credit rating by Standard & Poor’s. During late 2015 and early 2016, a slowdown in China’s growth, an unexpected devaluation of China’s currency, and the collapse in oil prices threw investors a short-term curveball.
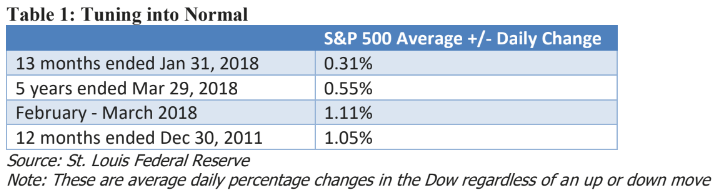
Volatility reentered the investment landscape in February after an unusually quiet period in 2017. Table 1 highlights the daily percentage changes in the S&P 500 Index over various periods.
In the 13 months that ended in January, the daily percentage change in the S&P 500 (up or down) was just 0.31%. That compares to a daily percentage change of 0.55% over the last five years.
Note the much larger average move in February and March. For comparison purposes, I’ve also included 2011, when stocks last experienced an extended period of volatility.
Final thoughts
Volatility can be unnerving, but recent action illustrates it is not unusual. The economic fundamentals remain solid, including economic growth, profit growth, still-low interest rates, and recent announcements of large stock buybacks by various firms (Wall Street Journal).
Stock market corrections of at least 10% are inevitable. But the fundamentals have helped to cushion the decline.
As a note by LPL Research recently pointed out, “Corrections (10% or greater declines) are never fun, but they also aren’t new territory for investors. Prior to the most recent example, we have experienced 36 corrections since 1980, and the S&P 500 fell by an average of 15.6% from peak to trough during these periods.
“Twelve months later, the index made up some ground, rising an average of 16.0% from the low, and after 24 months, the S&P 500 had climbed by an average of 28.0%, reinforcing the need for long-term investors to maintain their diversified strategies.”
Please feel free to reach out to me if you any questions or have any items you would like to discuss.