
MONTHLY FINANCIAL MARKET UPDATE
The summary below is provided for educational purposes only. If you have any thoughts or would like to discuss any other matters, please feel free to contact me.
A Banner Year, A Banner Decade
The decade began under a dark cloud. The U.S. was climbing out of the Great Recession, and many wondered whether the economy might flounder for years. However, as investment legend Warren Buffett likes to say, “Never bet against America.(NBER)”
The economy exited the Great Recession in July 2009 (NBER). As of July 2019, the expansion became the longest on record. The unemployment rate ended 2009 at 9.9% and fell to 3.5% as of November 2019. Over the same period, 22.4 million jobs were created (St. Louis Federal Reserve).
The S&P 500 Index3 bottomed on March 6, 2009 at 676.53, closed at 1,115.10 on December 31, 2009. Ten years later, it finished the decade at 3,230.78. Figure 1 provides a graphic illustration of the long-running bull market.
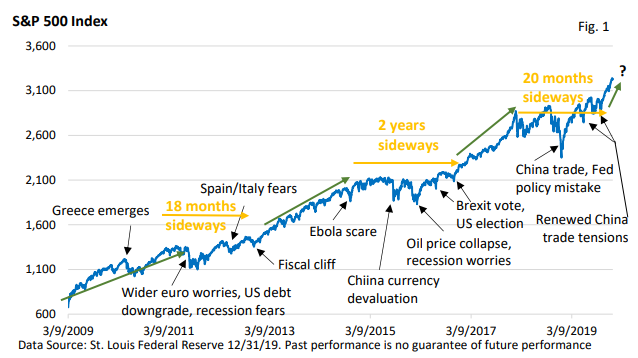
We see a bull market that can be roughly broken into three periods, interrupted by sideways action that lasted approximately 18 to 24 months.
We recognize that stocks don’t move up in a straight line, and Figure 1 highlights the hurdles that temporarily sidelined the bulls. Yet, powerful tailwinds provided by modest economic growth, profit growth, low interest rates, low inflation, and corporate stock buybacks helped power gains throughout the decade.
The two biggest periods of volatility occurred in 2011 and late 2018. During 2011, recession worries surfaced amid an expanding eurozone debt crisis.
During late 2018, growing trade tensions between the U.S. and China collided with anxieties that Fed rate hikes might push the economy into a recession. But rate hikes that began in late 2015 didn’t carry over into 2019. Instead, the Fed cut the fed funds rate three times, from 2.25- 2.50% to 1.50-1.75%.
2019
A look back at 2019 shouldn’t exclude the final quarter of 2018, when the S&P 500 Index lost nearly 20%. At the time, the Fed was on rate-hike autopilot, the global economy was slowing, and the U.S. and China were bickering about trade.
As the year unfolded, Figure 2 illustrates market action was dominated by U.S.-China trade headlines and Federal Reserve policy.
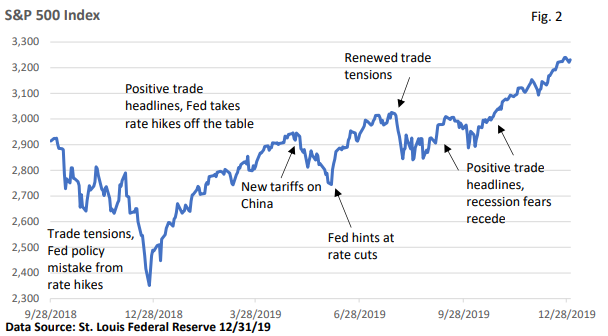
When volatility surfaced, trade was the epicenter of investor angst. Still, pullbacks during the year were modest by historical standards, with the S&P 500 Index falling by less than 7% during May and August.
As the calendar marched toward the end of the year, stocks recorded new highs as mid-year recession fears subsided, the U.S. and China finally agreed to a limited trade deal, and the Fed cut rates three times.
Further, optimism is slowly rising that the global economy may be stabilizing.
Collapsing yields
One of the biggest surprises of the year was the downturn in Treasury bond yields – see Figure 3. The drop in yields coincided with late 2018 stock market volatility but continued even as stocks recovered.
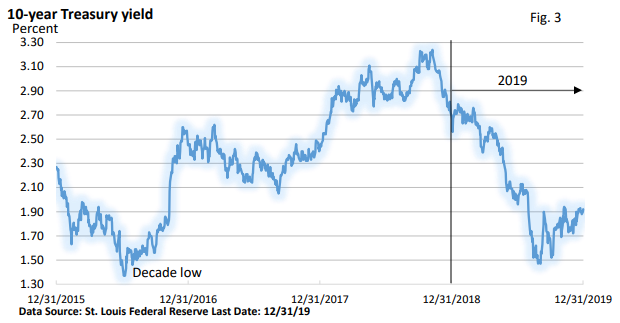
Several factors played a role.
The Fed shifted gears and cut rates, U.S. economic growth moderated, and key measures of inflation remained low.
Plus, yields around the world tumbled, which made Treasury bonds an attractive alternative.
As longer-term yields in the U.S. declined, the yield curve inverted, which means that the 3- month T-bill and the 2-year Treasury sported higher yields than longer-term bonds such as the 10-year bond.
The inversion between the 2 year and 10 year was very brief; nonetheless, inversions have historically preceded recessions. So, is it different this time?
Record highs in the stock market suggest that investors are optimistic as the near year begins. The steep drop in global yields may have distorted yields at home by artificially pulling them down and inverting the curve.
A look ahead
We began 2018 with unbridled optimism. Yet, stocks peaked in January, leading to the first decline in the S&P 500 Index since 2008.
Investors began 2019 in a somber mood, but the year recorded its best performance since 2013. Does that mean we’re in for another troubling year? Well, the S&P 500 Index posted a gain of 11% in 2014 after 2013’s banner year. So, let’s not read too much into the 2018-2019 pattern.
Many argue that the long-running bull market is living on borrowed time. A bear market must be lurking around the corner, right?
Economic cycles feed bull and bear markets
Since the mid-1960s, bear markets have centered around recessions. The one glaring exception: the one-day 1987 stock market crash.
Much will probably depend on the economy. While trade tensions created some worries, the consensus that economic growth wouldn’t stall likely cushioned the downside when volatility surfaced in May and August.
Taking a longer view, economists generally have an unenviable record of forecasting a recession. No one’s crystal ball is perfect, but conditions that have historically preceded a recession aren’t in place today.
1. Rising interest rates/rising inflation (recessions: 1974, 1980, 1982, 1990, 2001),
2. A credit squeeze that cuts off cash to businesses and consumers (recessions: 1980, 2008),
3. Asset bubbles (recessions: 2001, 2008). While we enter 2020 at highs, valuations in 2000 (earnings vs stock prices) were much higher. Interest rates were also higher.
4. Oil supply shock (recessions: 1974, 1990).
In addition, the decade-long economic expansion has been subpar by historical standards, i.e., it’s been boring. It hasn’t produced excess euphoria that generates excessive business investment and economic imbalances, as we saw in the late 1990s.
We’re in uncharted economic territory today, and the unemployment rate is low. Longer term, the stock market responds to the economic environment. We’ve seen that occur in previous expansions and recessions, we saw it during the last decade, and it seems likely to continue as we move forward.
Investor’s Corner
Control what you can control. You can’t control the stock market, and timing the market isn’t a realistic tool. But the one variable you can control is your investment portfolio.
Among other factors, your plan should consider your time horizon, risk tolerance, and financial goals. Investors with a long-term time horizon that adhere to a holistic financial plan, which takes various cycles into account, are on the best path to wealth creation and their financial goals.
Risks never completely abate, but they can be managed while taking advantage of the long term upward bias in stocks.