MONTHLY FINANCIAL MARKET UPDATE
The summary below is provided for educational purposes only. If you have any thoughts or would like to discuss any other matters, please feel free to contact me.
October’s Cool Breeze Flows into November
The midterm elections have ended, and stocks were supposed to resume their upward march, right? Did you know that since 1950, the S&P 500 Index has gained ground in every 12-month period that followed a midterm election? It’s an impressive 17 for 17, according to stats complied by the Wall Street Journal. The average increase has been 15.3%.
Well, we’re less than four weeks outside the election, and shares are struggling to follow the script.
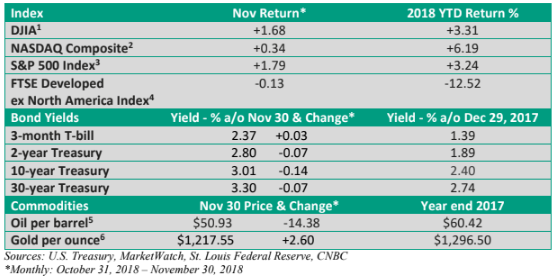
The S&P 500 Index shed 10.2% from its September 20th high to the most recent low the day after Thanksgiving (St. Louis Fed). The decline wasn’t atypical and was likely related to the various economic fundamentals. Thanks to a late-month rally, major U.S. market indexes managed to end November in the green.

What’s been going on? For starters, the leaders for much of the bull market, high-flying technology stocks, have come under pressure due to regulatory and global growth concerns. Without leadership from some of the big-name tech stocks, we’ve witnessed selling in other sectors.
Still, a 10% correction in a major index isn’t out of the ordinary. In fact, since 1980, the average intra-year pullback for the S&P 500 has been just under 14% (LPL Research). We’ve yet to see a selloff of that magnitude.
Moderating U.S. economic growth
More recently, there have been growing signs the U.S. economy is slowing down from the fast pace witnessed earlier in the year.
Housing starts and housing sales are down from recent peaks (data from U.S Census and National Assoc of Realtors), and weekly first-time claims for unemployment insurance, a good leading indicator of economic activity, have edged up from the September low (Dept of Labor).
Moreover, global economic growth has been slowing for much of the year. It’s not enough to tip the U.S. economy into a recession, but it seems likely to create stiffer headwinds for U.S. exports and ding profits for firms that conduct a significant share of business overseas.
Given signs that growth is moderating at home, analysts have been trimming 2019 profits estimates (Thomson Reuters).
While trade tensions with China have created uncertainty, the U.S. announced at the end of the month it will postpone its threat to increase tariffs on $200 billion in Chinese goods to 25% from 10% (WSJ). But obstacles remain to a more permanent deal that protects U.S. interests and opens Chinese markets.
Rate Worries
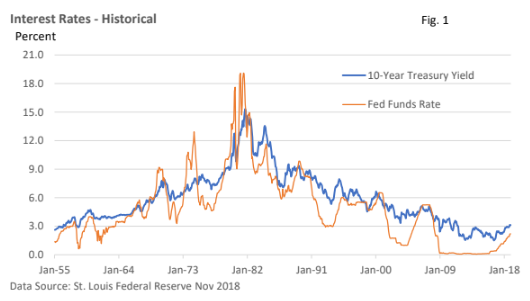
Then, there have been rate worries. Eight rate hikes by the Federal Reserve since late 2015 did little to dent sentiment through September. Figure 1 illustrates that rates are off rock-bottom levels but aren’t far from historical lows.
We must go back to the 1950s to find a 10-year Treasury yield below 3% (excluding post-financial crisis yields). A fed funds rate at 2.0-2.25% is also at the low end of the 60-year range – see Figure 1.

While rates haven’t risen in response to an unwanted rise in inflation, investors have begun to fret the Fed might overshoot on the upside and slow growth too much.
Soothing comments from Fed Chief Jerome Powell in late November appeared to quiet concerns that the Fed was on “rate-hike autopilot.” In other words, the Fed suggested it is flexible and could slow any plans to boost interest rates in 2019.
Crude awakening
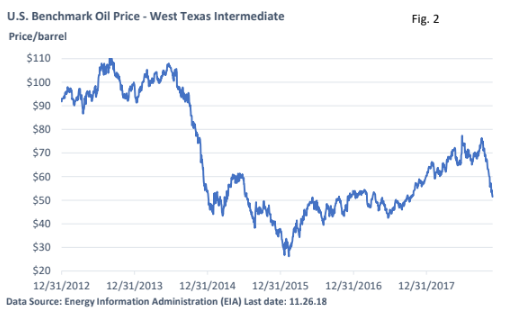
Oil prices have plunged – see Figure 2. The recent sharp decline in crude oil has its roots in several factors.

Slowing global growth, the stronger dollar (as oil is priced in dollars), and the Trump administration’s decision to allow some countries to purchase Iranian crude have played a role. Waivers from the sanctions that began in November were expected, but they were more generous than most had anticipated.
However, one of the biggest factors may be “Made in the USA.”
Thanks to price hikes earlier in the year, oil companies have been drilling for profits in the shale fields at home. Unlike conventional drilling, which can take years to produce oil, shale can be tapped much more quickly.
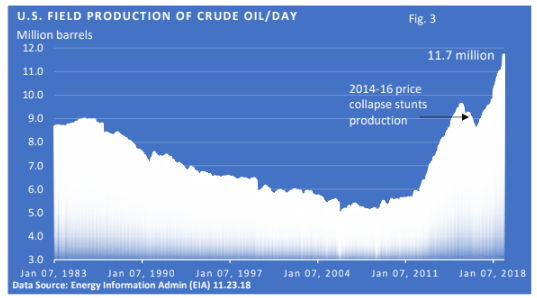
Based on estimates provided weekly by the Energy Information Administration, U.S. oil production has risen to 11.7 million barrels per day (Figure 3), ahead of number 2 Russia and number 3 Saudi Arabia.
It’s another way of saying the U.S. is now the largest oil producer in the world. Moreover, production has not only been rising, the pace has been accelerating.

Throw all the variables into the oil price equation and we’ve witnessed a steep decline in price.
Final Thoughts
Volatility is a normal part of investing. Stocks have a long-term upward bias, but the ascent has not been without pullbacks.
While moderation in U.S. growth may be temporary, recent uncertainty has encouraged investors to reprice risk, i.e., discount the slowdown in U.S. economic growth and profit growth. It’s an inexact science and markets can and do sometimes overshoot, both to the upside and the downside.
Yet, the odds of near-term recession remain are low, which has helped cushion the downside. In recent years, previous corrections have run their course when any economic fears turned out to be overblown and economic growth didn’t falter.


