
MONTHLY FINANCIAL MARKET UPDATE
The summary below is provided for educational purposes only. If you have any thoughts or would like to discuss any other matters, please feel free to contact me.
A Strong Start to the Year
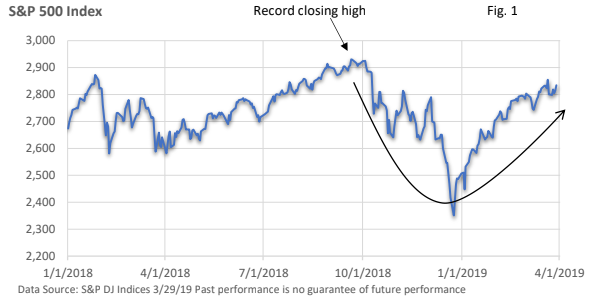
The first quarter feels as if it has been the mirror image of the final quarter of 2018. Economic conditions are far from robust, but investors have jumped back into stocks, brushing aside fresh concerns. In fact, the S&P 500 Index 3 turned in its best quarter since Q3 2009, per the Wall Street Journal.
The Fed’s newfound flexibility has played a big role in supporting the market, in my view. In December, the Fed was talking about two rate hikes this year. That has changed. The Fed is no longer on rate-hike autopilot. Instead, it is carefully looking at the economic data as it contemplates its next move.
Crosscurrents have developed at home and the global economy has slowed. We’re seeing it in the trade data and specific sectors of the economy, including housing and autos.
The latest Fed forecast projects no rate hikes this year, and Fed Chief Powell pushed back against talk of a 2019 rate cut at his March press conference.
Cautious optimism about a U.S.-China trade agreement has also lent support. Despite favorable headlines, the two economic powers have yet to conclude an agreement that opens Chinese markets to U.S. goods, protects intellectual property of U.S. companies, and prohibits forced technology transfers. Most reports suggest the enforcement mechanism of any deal has been the sticking point.
Yielding to the curve
While the data are not pointing to an economic contraction, the economy has entered into a slower orbit of growth. Coupled with slower economic growth around the globe, we witnessed an inversion of the yield curve for the first time in over a decade.
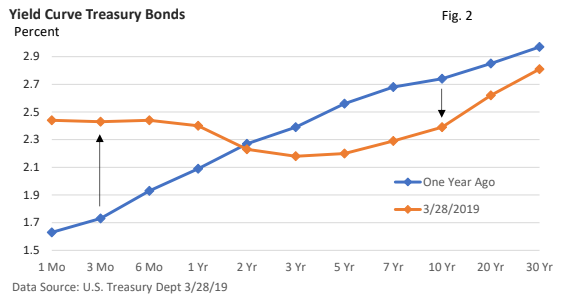
What is the yield curve? The yield curve plots the yields of a bond with the same credit quality (such as Treasuries) over various maturities. It’s illustrated in Figure 2.
A year ago (3/29/18) the curve was “normally” sloped – longer-dated maturities offered a higher yield. Today, we see a “kink” in the curve. As of 3/28/19, the 10-year bond yielded less than the 3-month T-bill.
Why do we care? Should we care? An inverted yield curve may restrict bank lending, but by itself, it does not cause a recession. Instead, it’s the bond markets signal that short-term interest rates may eventually fall in response to an economy that is expected to weaken.
Importance: the 10-year/3-month has inverted prior to each of the last seven recessions, according to data provided by the St. Louis Federal Reserve. The one glaring exception – the curve inverted in 1966 without an ensuing recession. But growth did slow considerably (St. Louis Fed GDP data).
On average a recession has occurred 11 months following the inversion of the 10-year/3-month T-bill.
That’s the bad news – any good news?
While the 10-year/3-month has inverted, not all signs point to a recession.
- The Conference Board’s Leading Economic Index® has been flat since October, but it has not turned lower. Historically, it declines in front of recessions, with an average lead time of 7 to 20 months (Advisor Perspectives). That’s quite a range and highlights the difficulty in predicting and timing a recession. But we’re not currently getting a recessionary signal from the LEI.
- During the last seven recessions, the 10-year/2-year Treasury yields inverted an average of 20 months before a recession (St. Louis Federal Reserve, NBER). It has yet to invert in this economic expansion.
- Low yields around the world may be encouraging bond buys in the U.S., which could be artificially pushing U.S. yields lower (bond prices and bond yields move in the opposite direction).
- Today, the Fed is on hold. Moreover, financial conditions have eased in the first quarter, according to the St. Louis Fed Stress Index and Chicago Fed National Financial Conditions Index. I get these aren’t household names, but they are followed closely by economists and Fed officials. Today’s levels signal access to credit isn’t restrictive and there is ample liquidity in the financial system.
- Finally, the steep drop in longer-term Treasury yields has pushed mortgages rates down sharply. In October, the average 30-year fixed rate mortgage was 4.90%, according to Freddie Mac’s weekly survey. As of March 28, the weekly survey placed the average rate at 4.06%. It supports the struggling housing market.
Final thoughts
Let’s not dismiss what’s happened to the yield curve. It’s been a long-running economic expansion and U.S. growth has slowed. But other warning signals aren’t pointing to a contraction. Throw the government shutdown into the mix and Q1 is unlikely to deliver impressive results.
Historically, we have seen a bounce in the second quarter. The St. Louis Fed notes that in recent decades, Q1 GDP has been “substantially weaker than growth in other quarters.”
Recessions have typically been preceded by major economic imbalances, such as a stock market bubble or housing bubble. Or, a sharp rise in inflation forces the Fed to aggressively respond with rate hikes.
For the most part, neither conditions are currently present, lessening odds a near-term recession is lurking. Further, recent market action has been impressive. It’s not as if we haven’t seen some volatility, but year- to-date performance isn’t suggesting an economic contraction is imminent.