MONTHLY FINANCIAL MARKET UPDATE
The summary below is provided for educational purposes only. If you have any thoughts or would like to discuss any other matters, please feel free to contact me.
Green Grass and High Tides
On April 23, the S&P 500 Index3 finished the day at 2,933.68, eclipsing its prior all-time closing high of 2,930.75. That was achieved on September 20, 2018 (St. Louis Federal Reserve).
We’ve experienced an impressive turnaround from the gloomy sentiment that pervaded the market late last year. It also marks an official milestone for the long-running bull market that began in March 2009.
Officially, the bull market, as measured by the S&P 500 Index, has extended its run past 10 years. Lengthwise, but not performance, it exceeds the 1990s (Figure 1). Note – bull markets come to an end when the index declines by 20% or more from a prior high. The three-month selloff in late 2018 came up just shy of 20% – down 17.77%.
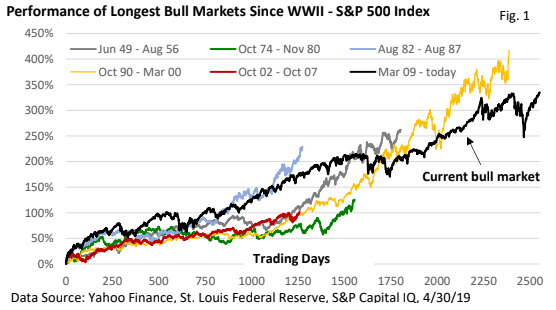
Over the last 50 years, bear markets have coincided with profit-killing recessions. The one notable exception – the 1987 one-day selloff. It topped 20%.
Coincidently (or not), 1998 and 2011 came up just shy of the arbitrary 20% figure. In both cases, a recession did not materialize. While a bear market is inevitable, we’re not yet writing the obituary on the current bull market.
The latest rally to a new high has been marked with low volatility, similar to what we saw during 2017.
While the lack of a sharp downdraft is welcome, let’s also recognize that selloffs aren’t unusual.
Look at Figure 2. Since 1980, the average annual gain in the S&P 500 Index, including reinvested dividends, has been 12.6%. The index has finished in positive territory 32 times, or 82% of the time. Yet, the average intra-year pullback totaled nearly 14%.
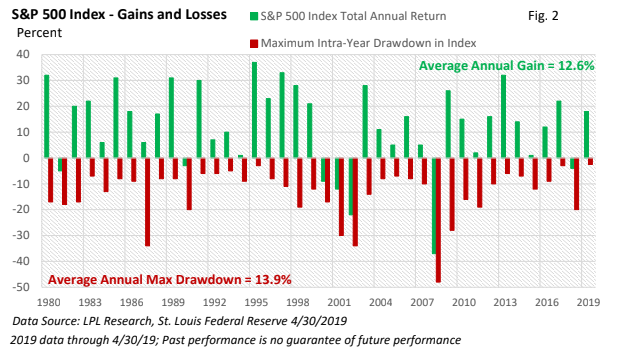
If history is our guide, a pullback this year can’t be ruled out. But, we see that broad-market indexes have historically had a long-term upward bias. Keep in mind that the average annual change can vary by a substantial margin.
A look behind the rally
- The first read on Q1 Gross Domestic Product (GDP), which is the largest measure of U.S. economic activity, came in at an annual pace of 3.2% (U.S. BEA). The headline number may not reflect the underlying trend for the quarter as consumer and business spending eased, but it’s still a solid start to the year. More importantly, near-term recession fears have subsided.
- In addition, economic growth overseas appears to be stabilizing.
- And, the Federal Reserve has said it doesn’t expect to hike interest rates this year.
It’s not that rate hikes, in response to stronger economic growth, will automatically trip up the bulls. Eight rate increases between December 2015 and September 2018 didn’t prevent new highs. But in October, investors began to suspect the Fed was on rate-hike autopilot.
At the time, the Fed seemed less concerned with the economic data and more concerned about getting interest rates back to a more normal level.
I get it. Money that’s too cheap during strong economic growth can create economic imbalances that rarely end well.
However, the Fed’s posture appeared to be too aggressive. As growth slowed late last year and stocks fell, the Fed took a much more cautious stance. A slowdown in inflation is also helping reinforce the central bank’s more flexible attitude.
- The U.S. and China have yet to reach a new trade agreement, and a setback could create unwanted volatility. But cautiously upbeat headlines have aided sentiment.
- Finally, Q1 earnings are topping a low hurdle (Refinitiv). We’ve seen this before. Companies issue conservative forecasts, analysts pare back estimates, firms top a low bar, and investors react favorably.
Risks never completely abate. When the grass appears to be too green and lush, and the high tide covers what lurks on the ocean’s floor, reality usually returns. But, when that occurs, keep Figure 2 in mind.