Rate-Hike Worries, Economic Uncertainties Cloud Outlook
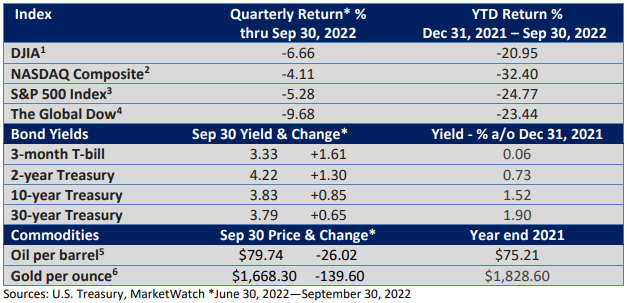
The table of returns reflects a continued drop in stocks and rise in yields during the third quarter. It does not reflect a bear market rally during July and early August.

The Federal Reserve hiked its key rate, the fed funds rate, by another 75 basis points (basis points = bp; 1 bp = 0.01%) in July to 2.25—2.50%. Some of Fed Chief Jay Powell’s remarks seemed to suggest the Fed might soon slow its pace of rate increases.
Predictably, stocks gained ground. In fact, the S&P 500 Index retraced more than 50% of its prior peak-to-trough decline (Bloomberg News).
But Fed officials pushed back on the idea of a Fed pivot. At the end of August, Powell’s short but direct nine-minute speech at a symposium in Jackson Hole, WY stressed the Fed’s resolve to bring inflation back down, and equities gave up ground.
A disappointing Consumer Price Index released in September and a very hawkish tone from the September 21st Fed meeting, including another 75 bp rate hike, signaled a steely resolve to squash inflation, and market volatility continued into the end of the month.

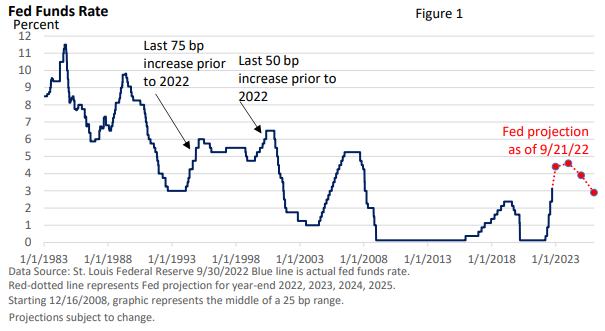
Take the Fed’s projections in Figure 1 with a couple of grains of salt.
The Fed failed to forecast the initial strength of the economic recovery and bet that last year’s surge in inflation would be transitory. Its forecasting models are not that credible right now.
But the shift in the rate forecast caught the attention of short-term traders. You see, the Fed raised its year-end forecast for the fed funds rate by a whopping 100 bp from June to 4.4% and its year-end 2023 forecast by 80 bp to 4.6%.
That’s a significant change in a mere three months. It signals that November might give us afourth-straight 75 bp rate hike and another 50 bp in December.
Even without those hikes, the Fed’s campaign has been the most aggressive since the second half of 1980, when it lifted the fed funds rate from about 9% to 19% in only six months, according to data from the St. Louis Federal Reserve.
Bottom Line
The speed and tenacity of the Fed’s moves have jarred investors. Higher interest rates compete for investor dollars and hamper economic growth.
The soaring dollar against major currencies, which has occurred amid heightened global uncertainty and higher rates at home (rising interest rates encourage foreign investors to seek higher returns in the U.S.), added to financial instability.
Additionally, the Fed’s campaign is raising fears that it could “break” something in financial markets, whether in the U.S. or abroad.
Although markets typically have an upbeat Q4, according to S&P 500 data from the St. Louis Federal Reserve, inflation has yet to decisively move to the downside and peak hawkishness has been elusive.
Furthermore, an economic downturn is a real possibility next year.
But bear markets end when negativity is high. No one rings a bell when the storm is over. We saw that in 2009, the steep market corrections of 2011 and 2018, and again in 2020.
During the recovery from the 2008-09 financial crisis and the pandemic-led bear market, sentiment remained decidedly negative as stocks initially rallied.
Economic and market forecasting is a very inexact science. Simply put, there are too many unknown variables. But the table below offers a historical perspective.

The peak-to-trough decline for the S&P 500 is 25.2% through September 30.

