Broker Check

7300 Wealth Connect – 7-17

MONTHLY FINANCIAL MARKET UPDATE

The summary below is provided for educational purposes only. If you have any thoughts or would like to discuss any other matters, please feel free to contact me.

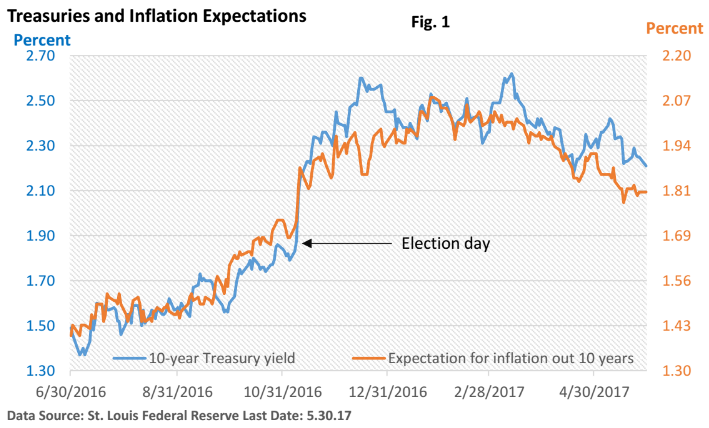
Like Watching the Paint Dry

Have you ever watched a movie or read a book that put you to sleep? One word – boring. It’s a rhetorical question, as all of us have been subject to a plot that failed to inspire.

Well, something similar has been happening to much of the stock market.

An end-of-June Wall Street Journal story started out this way. “Stock market volatility is near an all-time low…”

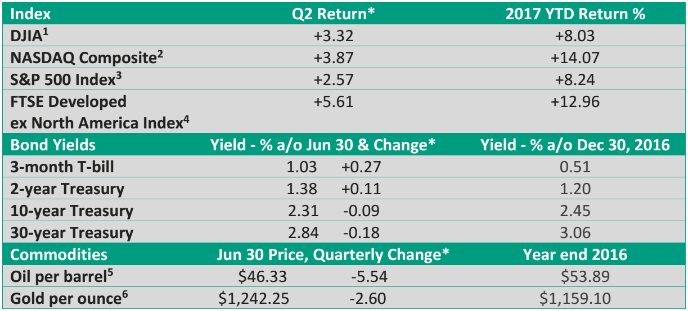
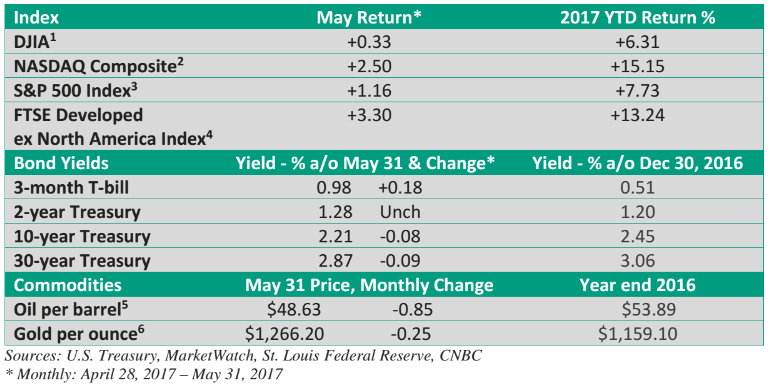
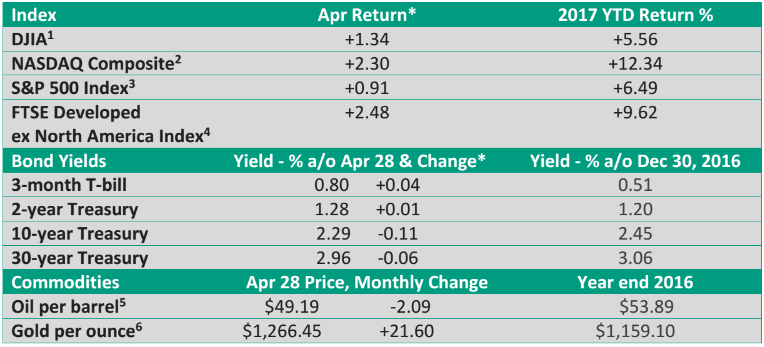
Sources: U.S. Treasury, MarketWatch, St. Louis Federal Reserve, CNBC *Quarterly: March 31, 2017 – June 30, 2017

On June 9, CNBC.com reported that one key measure of volatility fell to its lowest reading since late 1993. That low came just after former FBI Director James Comey’s much-anticipated testimony before a Congressional committee. Viewed through the narrow lens of the market, investors just didn’t care.

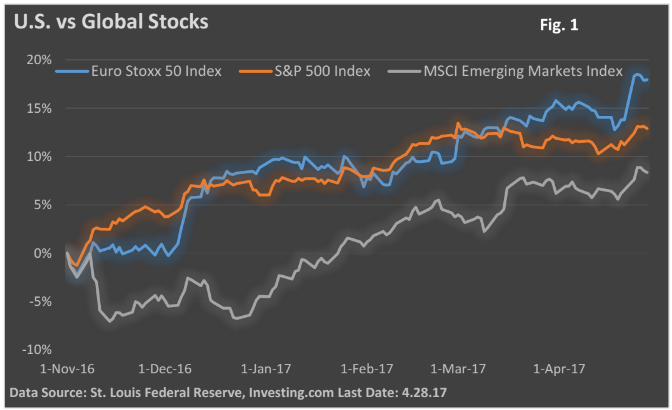
But boring shouldn’t necessarily be viewed negatively. The Wall Street Journal also pointed out that several major global indexes had their best first-half performance since 2009.

We also see the lack of downside action in the weekly movements of the broad-based S&P 500 Index, which is a measure of 500 large U.S. companies.

Figure 1 highlights the percentage weekly change in the S&P 500 Index – Friday’s close to Friday’s close.

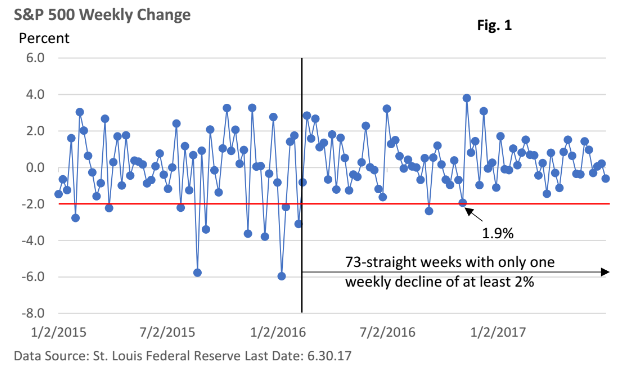
Since February 2016, the index recorded just one weekly decline of greater than 2%. That’s 72 of 73 weeks.

According to LPL Research, it’s the longest comparable streak since “61-straight weeks (all less than 2%) ended in early 1996. The year 1995 is also the last time a full year didn’t have a weekly 2% drop. Since 1950, the S&P 500 has averaged six 2% weekly drops per year.”

Chillin’

There have been several reasons for the complacency, including an economy that isn’t rocking the economic boat, an expanding global economy, a Federal Reserve that continues to signal gradual rates hikes, and global central banks that remain in a very accommodative mode (though the European Central Bank has hinted it may eventually shift gears).

One other reason—the lack of stress in the financial system.

Financial stresses became a big issue in the 2008 financial crisis, when credit market seized up and lending among banks and other institutions nearly broke down.

In the aftermath of the crisis, arguments arose over how to monitor developments in the financial markets.

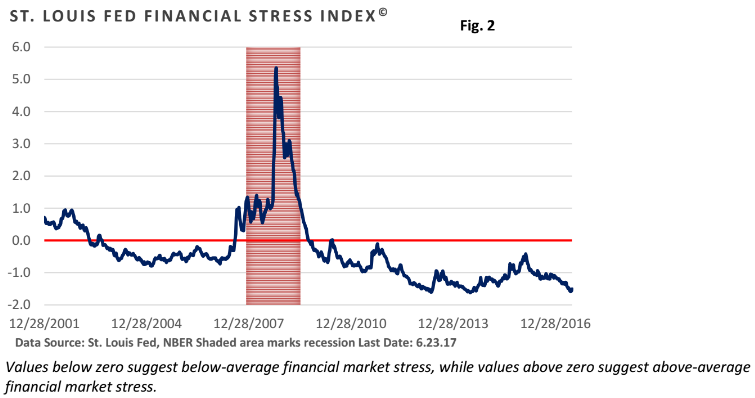
One tool is the St. Louis Fed Financial Stress Index©. It’s hardly a household name, but it is designed to measure stresses that may be building in the financial system.

It is a compilation of 18 weekly data series, including those that measure lending in the credit markets, volatility of stock prices, and how investors view risky debt such as junk bonds.

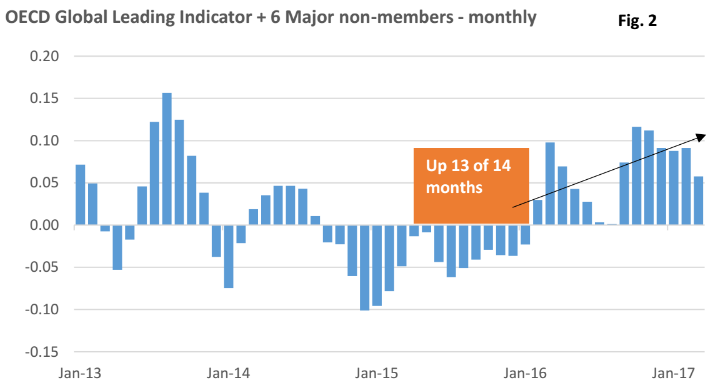
As highlighted in Figure 2, conditions are quite easy and are near the lowest levels seen since the recession ended.

There are a number of contributors to today’s “relaxed” mood in the credit markets.

Few leading indicators point to a recession at home, corporate profits are rising, and the Federal Reserve is boosting rates at a gradual pace.

In addition, investors aren’t very concerned about weak spots overseas, including some of the troubled economies in Europe and emerging markets.

Some will argue that complacency precedes volatility, and a more serious downturn in stocks is eventually inevitable.

We have experienced four downturns in the S&P 500 that were greater than 10% since 2010 per St. Louis Fed data. However, in the context of an expanding economy, stock market corrections have historically been viewed as temporary and healthy for the market. That has been the case for such downturns since 2010.

Some will say valuations may be a bit extended, especially in some high-flying tech stocks. However, successfully timing a selloff and re-entering shares near the bottom is a feat that is rarely successful.

Think of it this way. Predicting stock market turns is akin to predicting a fumble in a football game. You know it’s an inevitable part of the game but even a well-respected sports commentator would come up short trying to call such an occurrence.

Baseball great Casey Stengel’s comment, “Never make predictions, especially about the future,” seems quite fitting.

Long-term investment plans, i.e., a financial roadmap, take unexpected detours into account. Markets never move up in a straight line, but those who try to successfully time the ups and down in stocks rarely find such moves to be profitable over the longer run.

If you have any questions or thoughts, please feel free to reach out to me.

7300 Wealth Connect – 6-17

MONTHLY FINANCIAL MARKET UPDATE

The summary below is provided for educational purposes only. If you have any thoughts or would like to discuss any other matters, please feel free to contact me.

Missing Mojo – Bond Yields Remain Low

The Federal Reserve has hiked the fed funds rate three times since it first raised its key lending rate over a year ago. And a closely watched gauge from the CME Group that measures rate-hike sentiment puts odds of a June increase at 95% as of the last day of May.

Sure, we’ve seen T-bill rates rise modestly and some money funds and CDs have ticked higher, but savers aren’t seeing rates anywhere near where they were before the 2008 financial crisis.

Notably, longer-term bond yields have actually dipped from recent highs – see Figure 1.

There are several reasons why yields haven’t risen much, and we can lay the blame on domestic as well as global markets.

Let’s start with the major central banks

The Federal Reserve has lifted rates but remains very cautious and continues to promote a gradual rate-hike trajectory.

But it isn’t just the Fed. While the U.S. central bank has begun to tighten, major banks such as the European Central Bank and the Bank of Japan continue hold their key rates at or below zero for short-term loans.

Further, neither bank signaled it may soon shift policy.

You see, central banks play an important role in what happens to rates, both in their own countries and in the U.S.

As the month ended, the 10-year German bond yielded just 0.30%, and the yield on Japan’s 10-year bond came in at a scant 0.05% (Bloomberg).

With the U.S. 10-year Treasury above 2%, investors overseas looking for a safe place to park cash can easily boost their yield by buying U.S. bonds, which helps keep a soft lid on U.S. yields (bond prices and yields move in the opposite direction).

U.S. inflation

Long-term bondholders are wary of any whiff of inflation. If the rate of price hikes were to jump, they could easily be stuck in a low-yielding bond whose annual payout doesn’t keep pace with inflation.

But inflation, as measured by the Consumer Price Index and the lesser-known PCE Price Index, remains very low.

The left-hand side of Figure 1 illustrates the 10-year yield is off last year’s low, but it has dropped about one-third of a percentage point from its recent high.

Also, note the recent decline in inflation expectations.

Expectation for inflation is based on the 10-year breakeven rate of inflation, or the 10-year Treasury yield minus the 10-year TIPs yield. It offers a rough forecast for the annual rate of inflation over a 10-year period, as the difference in yield on a TIPs security and a 10-year Treasury represents the yield an investor is willing to give up for protection against inflation.

A U.S. expansion that just can’t get out of second gear

Not only is weak economic growth a headwind to higher inflation, it acts like a magnet for U.S. Treasuries.

If growth were much faster, we’d likely see funds flow out of Treasuries and into more productive investments.

A flight of capital away from U.S. Treasury bonds would drive yields higher. Remember, the price of bonds and the yield move in the opposite direction.

Jump down to Figure 2. It tracks the growth of Gross Domestic Product (GDP), which is the broadest measure of activity for the economy, and compares it with the yield on the 10-year Treasury bond.

Nominal GDP calculates GDP based on current prices. Real GDP, which is how it is typically reported in the media, filters out inflation.

Figure 2 illustrates that the 10-year yield loosely tracks nominal GDP. Put another way, subpar GDP has been a headwind to higher yields.

Currently, nominal GDP might suggest the 10-year yield should rise. But remember, yields around the globe are low, central banks outside the U.S. are in no mood to raise interest rates, and the Fed continues to signal any rate hikes are expected to be gradual.

Bottom line—there are technical factors that also influence the daily inflows and outflows out of bonds.

While volatility in rates can’t be ruled out, the major influences on today’s low-rate environment have yet to abate.

If you have any questions or thoughts, please feel free to reach out to me.

Warmest Regards,

Christopher J. Carroll, CIMA®, CBC®
Founder, Portfolio Manager, and Managing Partner

7300 Wealth Connect – 5-17

MONTHLY FINANCIAL MARKET UPDATE

The summary below is provided for educational purposes only. If you have any thoughts or would like to discuss any other matters, please feel free to contact me.

It’s Not Just U.S. Stocks that Have Surged

U.S stocks haven’t been the only winners since election day. Stocks in Europe and around the global have performed admirably against a backdrop of faster economic growth and still-low interest rates.

Since the beginning of November, a major market index in Europe has outperformed the S&P 500 Index3, a key gauge of large U.S. firms – see Figure 1.

An important measure of emerging market stocks fell sharply in the wake of last year’s election. While U.S. markets jumped amid expectations of tax cuts and infrastructure spending, investors snubbed emerging markets, fearing that Trump’s trade policies would punish the economies of developing nations. As Figure 1 highlights, those fears have since subsided.

The Euro Stoxx 50 is an unmanaged index of major European companies which cannot be invested into directly. Past performance does not guarantee future results.

The MSCI Emerging Markets Index is an unmanaged index of companies in developing nations. The index cannot be invested into directly. Past performance does not guarantee future results.

What’s going on? For starters, major global central banks outside the U.S. continue to pour money into the financial system through the purchases of bonds and other financial assets. Two in particular are the European Central Bank and the Bank of Japan, which have yet to hint at increasing rates.

Of course, monetary policy alone doesn’t determine the direction of stocks. The Federal Reserve has lifted rates three times since its rate-hike cycle began, and U.S. shares are near or at record highs. Besides, ultra-low rates, coupled with non-existent growth, would not be a recipe of surging share prices.

More importantly, faster economic activity that fuels growth in corporate profits, is aiding stocks at home and around the globe.

In conjunction with Q1 earnings releases, a number of major U.S.-based industrials, which conduct a large portion of business overseas, have raised forecasts for 2017 (CNBC, firm-specific investor relations). This is important because simply maintaining guidance would have suggested growth might not be accelerating.

Moreover, FactSet reported last month that S&P 500 companies with greater global exposure are posting higher earnings than those with most of their sales at home.

You see, large U.S. industrials act like a global economic pinwheel. In the aggregate, they are akin to a “boots-on-the-ground” review of global economic conditions.

Key data points

The Organization for Economic Cooperation and Development (OECD)’s Composite Leading Indicator, which covers its 35 members (plus 6 major non-members), has been positive for 13 of the last 14 months.


Data Source: OECD Last Date: March 2017

Markit Economics publishes its monthly purchasing manager (PMI) surveys for several major countries. The PMIs that survey nations in Europe just hit their best level in six years, signaling the growth in Europe is accelerating. Further, the threat of deflation in Europe has waned, aiding the more upbeat outlook.

While risks remain, China, which came under pressure last year, posted annual GDP growth in Q1 of 6.9%, the fastest increase since Q3 2015 (MarketWatch).

Emerging markets step on the gas

Emerging markets (EM) can be defined as a nation’s economy that is progressing toward becoming advanced. It is typically characterized by faster growth than developed nations, but is more subject to volatility, political instability, and external shocks.

China and India are the largest EM economies. Other nations include South Korea, Brazil, Taiwan, South Africa, and Poland.

Depending on your risk profile, we may recommend investments in these countries be included as a part of a well-diversified portfolio. But be aware they can exhibit a heavier degree of volatility than what might be associated with mature economies.

That said, investors shrugged off initial anxieties reflected in the key gauge that tracks EM economies shortly after Trump’s election and have narrowed the gap with Europe and the U.S. – Figure 1.

In addition to growth prospects, the softer dollar and the general belief the Fed will remain in a go-slow mode have also aided emerging markets.

Let me explain. A stronger dollar can hurt EM economies, as some nations issue debt denominated in U.S dollars. So, a rise in the dollar makes it costlier to repay loans. Plus, a more aggressive series of Fed rate hikes could boost the dollar as well as siphon cash away from EM economies and into the U.S.

Many EM nations are dependent on commodity prices, as raw materials are a key export. More recently, commodity prices have tiptoed higher following a long slide, per the CoreCommodity CRB Index, a broad- based basket of commodity prices. Furthermore, earnings expectations are up sharply in 2017 versus one year ago (Charles Schwab).

Sources: U.S. Treasury, MarketWatch, St. Louis Federal Reserve, CNBC
* Monthly: March 31, 2017 – April 28, 2017

Bottom line—it’s been a confluence of factors that have boosted the fortune of stocks around the globe. It’s also an important reminder that a long-term investment plan for most investors should include a diversified international component.

If you have any questions or thoughts, please feel free to reach out to me.

Warmest Regards,

Christopher J. Carroll, CIMA®, CBC®
Founder, Portfolio Manager, and Managing Partner

7300 Wealth Connect – 4-17

Monthly Financial Market Update

The summary below is provided for educational purposes only. If you have any thoughts or would like to discuss any other matters, please feel free to contact me.

Political Uncertainty as Viewed Through an Investment Lens

The overriding theme that has engulfed markets during the first quarter, particularly stocks, has been Donald Trump and the general belief that he will enact policies that will spur economic growth and boost corporate profits. Never mind any lingering anxieties that his more controversial positions might detract from economic growth.

Sources: U.S. Treasury, MarketWatch, St. Louis Federal Reserve, CNBC
*Monthly: February 28, 2017 – March 31, 2017

Of course, Trump can’t cut taxes and boost outlays on infrastructure projects simply by decree. He’s half the equation. Congress must still enact measures that reach his desk.

So, what happens if Congress deadlocks and nothing gets passed? Worries abound that investors are front-running changes in fiscal policy that may not occur.

Washington does not work like a well-oiled machine and compromises must still be hammered out. Odds are low at this point, but if the gears get gummed up and Congress fails to implement reforms, volatility is likely to ensue. What type of short-term fallout we might experience is difficult to forecast.

It’s a remark that found its way into last month’s commentary.

Well, for better or worse, Washington isn’t a well-oiled machine. That was vividly demonstrated when Republican leaders in the House pulled their bill to repeal and replace Obamacare when the votes weren’t there.

Whether Obamacare should be repealed or whether the Republican replacement was the right prescription is not in the scope of this month’s summary. What impacts investors is.

More importantly, investors have been anticipating a sharp reduction in the corporate tax rate. The math is simple. A lower tax rate boosts after tax earnings, which is positive for stocks. It may also induce firms to invest in various tools to boost output and productivity, which would aid economic growth.

But the inability to pass the health care bill raises the odds we might not see tax reform, as it highlighted the deep divisions within the Republican Party.

Republicans share common tax goals, including lowering rates for individuals, eliminating the alternative minimum tax, and slashing the corporate tax rate. Still, passage isn’t guaranteed.

While political noise can create volatility, the standoff with the health care bill didn’t spark much of a selloff. In fact, the major indices ended the week higher following the bill’s apparent demise.

Partisanship may create uncertainty at the Capitol, but investors care most about economic and profit growth. It is the long-term driver of stocks.

The Fed engages

When the year began, it appeared the Fed was gearing up for a rate hike in June. It would be the first of three expected increases in the fed funds rate.

Data Source: St. Louis Federal Reserve, Economic Projections of Fed Officials, NBER

Shaded areas mark recessions – Last Date: March 2017

Inflation rate as determined by the core PCE Price Index (excludes food and energy) Broken line represents current forecast for the fed funds rate per the Economic Projections of Federal Reserve Board Members and Federal Reserve Bank Presidents under their Individual Assessments of Projected Appropriate Monetary Policy Fed funds rate median projection of 1.375% at year-end 2017 and 2.125% at year-end 2018. Forecasts are subject to change

That changed in late February, when several Federal Reserve officials, including Fed Chief Janet Yellen, strongly hinted that March was in play.

When the March 15 meeting concluded, the Fed surprised no one by announcing it was raising the fed funds rate by 1⁄4% to a range of 0.75 – 1.0%.

Despite chatter the Fed might tweak the needle in a slightly more hawkish direction by raising projections from three rate hikes this year to four, it chose to maintain guidance at three. If that occurs, we would have a fed funds rate of 1.25 – 1.50% by the end of the year – see Figure 1.

“We realize that waiting too long to scale back some of our support (low rates) could potentially require us to raise rates rapidly sometime down the road, which in turn could risk disrupting financial markets and pushing the economy into recession,” Yellen pointed out in early March.

While she was cautiously optimistic on the economic outlook, she said expected rate increases should be “gradual.”

Pumped up profits

Ultimately, it’s about corporate profits, and the outlook for the rest of the year is favorable.

As of March 31, Thomson Reuters estimates earnings for S&P 500 companies, which captures about 80% of the total U.S. market capitalization (Dow Jones Indices), are expected to rise 10.2% from a year ago. That’s down from an estimate of 13.8% made at the beginning of the quarter.

Data Soure: Thomson Reuters Last Date: 3.31.17
All forecasts are subject to change

Since the early days of the economic recovery, analysts have lowered their estimates in response to conservative forecasts issued by firms. It’s an under-promise, over-deliver strategy. If we follow the same pattern this time around, firms will post their first double-digit rise in profits since Q3 2014.

According to Thomson Reuters, expect the most support to come from financials, technology, and energy. Energy played a significant role in the earnings recession, thanks to the collapse in oil prices. While prices have been shaky as of late, they are up from a year ago.

Later in the year

Anything past Q2 gets dicey and depends on several factors. Foremost, how the economy performs.

The theme that is being driven home? Be careful reacting to news items or political noise that may create temporary volatility, but fails to shift the narrative that has driven stocks from the March 2009 low.

We’ve seen it before: economic and political uncertainty in Europe, political gridlock at home, Brexit, China, geopolitical anxieties, and more.

When new problems crop up, and they will, uncertainty can quickly affect short-term market sentiment. But if it fails to materially dent the U.S. economic outlook, it’s unlikely to have a longer lasting impact on stocks.

When might we get a more pronounced downturn? Historically, bear markets correlate closely with recessions. A recession will eventually set in, and stocks will turn down. But recessions have historically led to economic upturns and new highs for stocks. It’s a pattern that’s repeated itself for over 200 years.

Warmest Regards,

Christopher J. Carroll, CIMA®, CBC®
Founder, Portfolio Manager, and Managing Partner

7300 Wealth Connect – 3-17

Monthly Financial Market Update

The summary below is provided for educational purposes only. If you have any thoughts or would like to discuss any other matters, please feel free to contact me.

Market Melt-Up

The Dow Jones Industrial Average1 ended February on a negative note, snapping a 12-day winning streak of record closing highs. Looking back at market history, the Dow came up one day short of tying a record of 13-closing new highs achieved in January 1987 (Gluskin Sheff/Business Insider).

The latest run can be traced back to comments made earlier in February by President Donald Trump. Following a very restrained “affirmative” on tax reform during a pre-Super Bowl interview with Fox News’ Bill O’Reilly, Trump quickly shifted gears and said he expected a “phenomenal” tax reform proposal within two to three weeks. That remark occurred on February 9 (CNN, the Hill.com).

Data Source: St. Louis Federal Reserve Last Date: 2.28.17

Details were lacking but the stock market rally gained new momentum.

But what about his combative nature? Could that create problems with shares? Well, so far it hasn’t, as investors have focused on the positives—expectations that fiscal stimulus will unleash the “animal spirits” that have been dormant and drive economic growth into a higher gear.

Fed Chief Janet Yellen offered a similar suggestion a couple of weeks ago when she was asked during her semi-annual testimony before two Congressional committees what she thought was driving stocks. “I think market participants likely are anticipating shifts in fiscal policy that will stimulate (economic) growth and perhaps raise earnings,” Yellen opined. Fiscal policy is simply a wonky way of saying tax cuts and infrastructure spending.

Her response fit neatly into some of the recent themes we’ve covered.

So, what happens if Congress deadlocks and nothing gets passed? Worries abound that investors are front-running changes in fiscal policy that may not occur.

Washington does not work like a well-oiled machine and compromises must still be hammered out. Odds are low at this point, but if the gears get gummed up and Congress fails to implement reforms, volatility is likely to ensue. What type of short-term fallout we might experience is difficult to forecast.

But let’s always remember that investors look to the future, using their collective wisdom (via buy and sell decisions) to discount potential events. It may not be a clear path, but at this juncture, there is the expectation reforms will eventually make their way to the president’s desk for his signature.

The 800-pound gorilla

Politics and the victory of Donald Trump (and a Republican Congress) have dominated the narrative since election day. Hindsight is 20-20, and it seems obvious today that investors would warm to his pro-business stance. His more controversial positions have done little to derail shares.

But if we look back over the last several years, domestic political themes that have cropped up from time to time held only a short-term sway over shares. The “fiscal cliff” at the end of 2012 created headwinds, until a last-minute deal took the issue off the table. And a 2013 government shutdown, coupled with the possibility the federal debt ceiling might be breached, cast a temporary shadow over markets.

Eventually, I suspect the political story line will run its course and the longer-term driver of shares will once again take center stage. In fact, I’d venture to say it’s already playing a role.

Data Source: Econ-Yale-Online data Robert Shiller Last Date: Dec 2016

Longer term, it is profits and the expectation of profits that drive stocks. Figure 2 highlights the close relationship between S&P 500 earnings and the S&P 500 Index.

Sure, there are times when shares sell at a discount to earnings, as we saw in the 1970s. At that time, interest rates and inflation were soaring, reducing the attractiveness of stocks.

Then came the late 1990s, when investors piled into almost anything with a “.com” after the firm’s name.

But by and large, it’s earnings that drive shares. In fact, the correlation between S&P 500 profits and the S&P 500 Index is an incredibly high +0.94, where +1.0 would mean the two variables perfectly mirror each other, and -1.0 would mean the two variables move in exactly the opposite directions. A zero simply means there is absolutely no correlation between the two variables.

Sources: U.S. Treasury, MarketWatch, St. Louis Federal Reserve, CNBC
*Monthly: January 31, 2017 – February 28, 2017

In other words, Figure 2 is a graphic illustration that demonstrates profits are the biggest long-term driver of stocks. Sure, other factors can come into play in the short term, but investors buy and hold shares for a firm’s earnings and expected earnings.

Warmest Regards,

Christopher J. Carroll, CIMA®, CBC®
Founder, Portfolio Manager, and Founding Partner

7300 Wealth Connect – 2-17

MONTHLY FINANCIAL MARKET UPDATE

The summary below is provided for educational purposes only. If you have any thoughts or would like to discuss any other matters, please feel free to contact me.

The Waiting Game

Much of the optimism over the last three months can be traced back to the themes that have been running since Election Day.

It’s a new administration that wants corporate tax cuts, individual tax reform, regulatory reform, higher defense spending, and a ramp-up in infrastructure spending. With the exception of new domestic outlays, the Trump administration is working with a sympathetic Congress.

Yet, it’s also an administration that has railed against globalism and has shunned large, multilateral trade deals. Markets like the former; they cast a wary eye on the latter.

For now, it’s not just investors that have warmed to the change in Washington and the perception that business-friendly legislation is just around the corner. First, let me state the obvious. The name Donald Trump elicits a myriad of reactions. Yet, surveys of consumer confidence have soared since the election, with the Consumer Confidence Index hitting its best reading in 15 years – see Figure 1.

Data Sources: Conference Board, Polling Report, NBER
Shaded areas mark recessions Last Date: Jan 2017

Moreover, a measure of small business confidence is at its highest level in over a decade (National Federation of Independent Businesses). One might say that the ‘animal spirits’ that drive economic activity are stirring.

Still, major proposals designed to create a more fertile ground for economic growth don’t happen overnight.

Washington moves slowly and competing interests can complicate matters. For example, talk of a “border adjustment tax” is a new wrinkle that just popped up on the horizon. But investors want a simple and clean cut in the corporate tax rate, dropping it from 35% to around 15-20%. In some respects, January has been an interim period – a waiting period. It’s one where investors have been trying to evaluate how the new administration will govern, what its priorities will be, and how it will move forward.

Following a strong finish to 2016, we saw the upward momentum in shares slow through much of the month. However, the Dow did top 20,000 for the first time when Trump got back on message (at least from a market perspective), meeting with business leaders and signing executive orders designed to speed energy pipeline construction and pare back on what he sees as burdensome regulation.

Sources: U.S. Treasury, MarketWatch, St. Louis Federal Reserve, CNBC
*Monthly: December 30, 2016 – January, 31 2017

Remember, it’s the pro-growth message we heard in November that sparked the rally in shares.

Still, Trump was not a conventional candidate, which was part of his appeal in some corners. And he has yet to shed his unorthodox ways. He’s not shy about tweeting his opinion or ruffling feathers.

Some like the new style. Others abhor it. As your financial advisor and financial confidant, I’m not here to offer opinions on his leadership, or use this space as a political platform.

My goal is to discuss themes that are affecting shares in either a positive or negative fashion. It’s to view what’s happening through the narrow prism of an investor. I’ll leave it to you to form your own conclusions regarding the broader aspect of his policy initiatives.

President-elect to president

Investors crave a fair degree of certainty. They want quick enactment of pro-growth policies. The roll-out of his more controversial stances, including the restriction on immigration, created political uncertainty and some turbulence as the month came to a close.

It not only raises fears that Trump may get sidetracked, but there are rising concerns the pro-business message heard in November and the laser-liker focus on taxes may end up taking a back seat to other proposals and squabbling among Congressional leaders.

Given the impressive run-up since Election Day, short-term traders used the political uncertainty as an excuse to sell as the month came to a close.

Long-term focus – the fundamentals

Longer term, it’s really about profits and profit expectations, economic growth, and interest rates.

The four-quarter earnings recession has ended, and earnings growth is forecast to accelerate and run above 10% in 2017 – see Figure 2. You have to go all the way back to early 2011 to find four-straight quarters of double-digit profit growth (Thomson Reuters).

Data Source: Thomson Reuters Last Date: 1.30.17 Forecasts are subject to change.

Of course, earnings forecasts are subject to change given that there are plenty of moving parts in the earnings forecast equation, including U.S. and global economic performance and the dollar.

Moreover, firms are posting profit margins that are near record levels (S&P Dow Jones Indices). An acceleration in wage growth would be welcome. So would a rise in business investment, but it would likely whittle away at margins. Of course, that would likely occur in response to faster economic growth, which is a tailwind for profits.

As you can see with this simple example, forecasts rely on plenty of changing variables.

Meanwhile, the economy continues to expand, and the Fed currently believes that gradual rate hikes are the most likely path.

Volatility can’t be ruled out. It is a natural part of investing. Risk can be managed but not eliminated. For now, the fundamentals are generally supportive of shares.

Warmest Regards,

Christopher J. Carroll, CIMA®
Founder, Portfolio Manager, and Founding Partner

7300 Wealth Connect – 12-16

Annual Financial Market Update

The summary below is provided for educational purposes only. If you have any thoughts or would like to discuss any other matters, please feel free to contact me.

An Average Year

That’s right, 2016 turned out to be an average year for stocks if you use the large-company S&P 500 Index as your yardstick. Going back to 1928, the average annual return, including reinvested dividends, runs nearly 10% (NY Stern School of Business data). When the year had ended, the S&P 500 rose 9.54%. Throw in dividends and 2016 rose 11.96% (MorningStar). Mid-cap and smaller company shares topped 20%.

Sources: U.S. Treasury, MarketWatch, St. Louis Federal Reserve, CNBC

Of course, these are just averages and returns can vary widely from year to year. Since the bull market began in early 2009 (St. Louis Federal Reserve), we’ve been treated to eight-straight years of positive returns for the S&P 500 Index (dividends included), with six of those in double digits (NY School of Business).

That always leads to the next question – or we near a top? I’ll attempt to provide perspective later in the summary. Spoiler alert – it largely depends on whether the U.S. economy is headed toward a recession.

A look back at 2016

The year finished on a solid note, but 2016 didn’t start out that way.

Falling oil prices, worries about China, an upward lurch in junk bond yields, and overblown fears of a recession took a big toll on investor sentiment. CNNMoney pointed out that the first ten days of the year were the worst start for the Dow in its history – that’s going all the way back to 1897.

To compound the angst, comparisons to 2008 were rife. However, this wasn’t 2008, there wasn’t a subprime crisis that was brewing, and shares touched bottom in early February (St. Louis Federal Reserve).

At the time, stocks were closely tracking oil prices. When oil prices bottomed, so did the S&P 500 Index (St. Louis Federal Reserve, Energy Information Admin.). Not coincidentally, so did the peak in junk bond yields (St. Louis Federal Reserve, Energy Information Admin.).

While tumbling oil prices had raised worries over demand and led to fears a recession might take hold, the reality was quite different – it was about too much oil, not fading demand in the economy.

Shares eventually moved off lows, and the closely-watched S&P 500 Index eclipsed its May 2015 high in July, when the surprise Brexit vote in the U.K. failed to create much turbulence in Europe.

Trump train spurs new highs

New highs experienced by the major U.S. indexes came despite the unexpected victory by Donald Trump. Most analysts believed a brief but violent selloff would ensue if the outsider won the election. Instead, talk of corporate and individual tax cuts, new spending on infrastructure, the repeal of Obamacare, and regulatory reform all served to spark a late-year rally.

The late-year surge in stocks came at the expense of longer-term Treasury bonds and high grade corporate bonds (St. Louis Federal Reserve). Figure 1 highlights the spike in Treasury yields (bond prices and yields move in opposite directions).

Data Source: St. Louis Federal Reserve, NBER Last Date: 12.30.16 Shaded areas mark recessions

Yields have been at or near historically low levels for much of the economic recovery. Very accommodating monetary policies from the major global central banks, low rates of inflation around the globe, a lackluster economy, and yields hovering near or below zero in parts of Europe have all played a role. Still, on a historical basis, Figure 1 illustrates that yields remain low.

The long cycles in oil

Oil is an incredibly important component in our economy. Falling gas prices have been a boon for drivers, but severe cutbacks by oil-related firms have forced layoffs and sharp reductions in expenditures in the industry. Moreover, it has hampered S&P 500 profit growth (Thomson Reuters).

We are witnessing a modest bounce in prices thanks to a recent OPEC decision to cut production. But even at today’s prices, rig activity in the shale producing regions is rising, promising to bring new output.

I won’t venture a guess where prices will end up next year, but as Figure 2 highlights, oil has historically moved in very long cycles. If that holds true this time around, we could see prices remain at relatively low levels for quite a while.

What’s in store this year

As with oil prices, forecasting how stocks will perform this year is dicey. Simply put, there are too many moving parts to the stock price equation, and each of those moving parts can affect one of the other moving parts.

But we can take a stab at some of the tailwinds and risks.

Since WWII, the U.S. economy has had 11 economic expansions, which were interrupted by recessions (National Bureau of Economic Research). At 73 months, the current expansion is the fourth longest, with the longest being 120 months in the 1990s (NBER).

The current recovery isn’t young anymore, but risks for a near-term recession in the U.S. are low. That’s important for investors because Figure 3 reveals that most bear markets, defined as a 20% decline, since the late 1950s were associated with a recession. The one most recent exception – the Crash of 1987.

Data Source: St. Louis Federal Reserve, NBER Shaded areas mark recessions Last Date: 12.30.16

Thomson Reuters is forecasting a return to S&P 500 profit growth in 2017, which would provide a tailwind for stocks. A gradual upward path in interest rates by the Fed would probably be viewed as a plus, especially if it were in response to an expanding economy.

Trump’s election sparked enthusiasm, primarily because he has touted pro-growth policies and downplayed his more controversial ideas. For example, it’s unknown if his tough trade talk during the election will result in dramatic new barriers to free trade or whether his rhetoric is simply a negotiating ploy.

You see, the vast majority of economists would argue that free trade is a net benefit to the U.S. However, “net benefit” is a fancy way of saying that winners exceed losers, but there are still losers.

You and I stand to gain when we buy cheap imports like big screen TVs that would cost more to manufacture in the U.S. Exporters gain access to foreign markets. Since 1990, exports as a percent of GDP have risen from 6% to 13% (U.S. BEA). That creates jobs for Americans and profits for U.S. firms.

But jobs have been lost when firms relocate plants abroad or when U.S. manufacturers can’t compete against lower-cost imports. If Trump were to follow through with threats to raise tariffs, U.S. trading partners could quickly retaliate, sparking trade war. Any heightened uncertainty could create volatility in stocks.

Of course, there are other unknowns. Will simmering problems in Europe or China bubble to the surface, or will unexpected geopolitical issues surprise investors?

What we have seen during this cycle – problems abroad that have not had a material impact on the U.S. economy have created temporary angst but have not killed the current bull market.

Another way to view this – those who have adhered to a long-range view and side-stepped the inevitable gyrations have profited.

Warmest Regards,

Christopher J. Carroll, CIMA®
Founder, Portfolio Manager, and Founding Partner

7300 Wealth Connect – 11-16

MONTHLY FINANCIAL MARKET UPDATE

The summary below is provided for educational purposes only. If you have any thoughts or would like to talk about any other matters, please feel free to contact me.

Investors Play the Trump Card

It’s simply a formality at this point. On December 19, the Electoral College will convene and electors will cast their votes. Barring any surprises, Donald Trump will become the 45th president of the United States.
While December’s vote is expected to produce few surprises, the election day results that put Trump in the win column caught most professional pundits off guard. The subsequent reaction in the market came as quite a surprise, too, with the major U.S. indices claiming new highs.

Sources: U.S. Treasury, MarketWatch, St. Louis Federal Reserve, CNBC
*Monthly: October 31, 2016 – November 30, 2016

Wasn’t a Trump win supposed to send shares lower, perhaps much lower? Weren’t we going to get a Brexit-like reaction in stocks? Didn’t investors prefer a win by Clinton because she represented continuity, even if her professed policies weren’t always business friendly? The answer to each question is yes. Yet, we’ll never know how stocks might have reacted to a victory speech by Clinton.

What we do know is that stocks briefly plummeted in overnight trading as it became clear The Donald was about to trump Hillary (Bloomberg). A gracious victory speech by Trump, which was followed by a conciliatory concession speech by Clinton seemed to soothe concerns.

Then, rational investors did what rational investors do – they turned their focus back to the fundamentals and liked what they saw.

Data Source: St. Louis Federal Reserve Last Date: 11.30.16

Missing from Trump’s victory speech were the more controversial policies he advocated during the campaign. What did dawn on investors was the simple fact that voters had just elected a Republican president and a Republican Congress that seems intent on passing pro-business/pro-growth policies.

A cut in the corporate tax rate will aid corporate profits, encourage capital spending, and discourage “tax inversions,” i.e., companies relocate overseas purely because other nations tax their firms at lower rates, sometimes substantially lower rates.

Then there is the prospect of tax reform that may simplify the filing process and reduce the tax burden, putting more spendable cash in the hands of consumers. In theory, that means additional consumer and business spending, which would fuel economic activity.

There has been no shortage of talk that more burdensome regulations may be pared back, including a more business-friendly environment for traditional forms of energy production.

Finally, Trump promises to pursue additional outlays for the nation’s aging infrastructure and for defense.

All in all, it was a remarkable shift in investor sentiment that had been very wary of a Trump presidency.

A Trumpnado hits the bond market

Tax cuts and higher spending would likely bring about faster economic growth. But it could also boost the federal deficit. Moreover, we could see an uptick in inflation.

All three acted like a perfect storm for the bond market, sending yields sharply higher, as investors bailed out of bonds (bond prices and bond yields move in opposite directions).

Data Source: St. Louis Federal Reserve Last Date: 11.30.16

The impact on investment grade corporate debt has also been significant, with yields rising substantially (St. Louis Federal Reserve). However, the reaction in the junk bond market has been far more muted (St. Louis Federal Reserve).

The potential for a more robust economy acts like a tailwind for the cash flow of firms that sport lower bond ratings. In other words, the prospect for easier debt repayments typically reduces the risk of holding low-grade corporate debt.

Where to from here

Of course, there are always risks to the outlook. We’re hearing plenty of talk of tax reform, higher government spending, and less regulation. But the devil is always in the details.

While the Republican majority is likely to make headway on lowering the corporate tax rate, plans put forth by Trump and House Republicans that cut individual tax rates differ in various aspects, and compromises will be needed.

Republicans in the Senate could use the reconciliation process (a simple majority is needed) to pass a bill and avoid a Democratic filibuster. Any moves to reach across the aisle, gather bipartisan support and pass a bill with 60 votes in the Senate will require additional give and take.

Tax cuts can have a more immediate impact on the economy, but major infrastructure projects have exceedingly long lead times. Additionally, Republicans and deficit hawks have historically cast a very wary eye on large domestic outlays.

How the market performs over the longer term will likely be tied to the economy, Federal Reserve policy, and the perception of valuations.

We’ve seen a number of events at home and abroad that have had a temporary impact on stocks since the bull market began in 2009. Yet, prospects for an expanding economy have proved to be a tailwind for the market.

We will eventually enter a recession. That’s inevitable. But the odds of one occurring in the near term are currently low.

Warmest Regards,

Christopher J. Carroll, CIMA®
Founder, Portfolio Manager, and Managing Partner

7300 Wealth Connect – 10-16

MONTHLY FINANCIAL MARKET UPDATE

The summary below is provided for educational purposes only. If you have any thoughts or would like to talk about any other matters, please feel free to contact me.

Modest Volatility, an Election, and a European Bank

The third quarter began on a very uneven footing. The U.K. had just surprised investors by voting to leave the European Union (E.U.), and markets were in the process of digesting an enormous amount of uncertainty and repricing shares in the face of that uncertainty. But hindsight has a way of offering clarity that’s difficult to grasp in the middle of the storm. While markets at home take their longer-term marching orders from profits and profit expectations, shorter term any number of variables such as the surprise vote in the U.K. can influence sentiment.

Sources: U.S. Treasury, MarketWatch, St. Louis Federal Reserve, CNBC
*Monthly: June 30, 2016 – September 30, 2016

In reality, Brexit led to a two-day selloff in shares (St. Louis Fed Reserve). When cooler heads prevailed, the selloff was quickly followed by new highs for the S&P 500 Index (see Figure 1) and the Dow.

Let me reiterate, when negative geopolitical or global events occur, they can create short-term selling pressures, as we’ve witnessed on several occasions. But if it does not impact the U.S. economic outlook, the event is usually discounted and investors tend to regain their composure.

It’s important to point out that we saw an unusual amount of complacency starting in mid-July. That complacency came to an end in September when talk surfaced of a potential rate increase at the Federal Reserve’s September 21 meeting.

However, this is a very cautious Fed. It’s in no mood to surprise financial markets. While it signaled a rate hike this year is still very much a possibility, the Fed also paired back rate hike expectations in 2017 and 2018 (Federal Reserve Economic Projections).

In other words, those patiently waiting for the day when safe investments will offer a more palatable return may have to wait even longer.

Still, let’s look past Fed policy and review the long-term driver of stocks – profits and profit expectations.

Figure 2 illustrates the earnings recession that began Q3 2015 may extend into the Q3 2016. But it also highlights a forecast of a much better fourth quarter, which has played a significant role in supporting shares.

Too big to fail

Let’s shift gears. Too big to fail isn’t just a topic here at home. It’s something European governments are also grappling with. While U.S. banks have done a much better job of raising capital, the same can’t be said of many of their European counterparts (CNBC, various sources).

At the end of June, the International Monetary Fund called Deutsche Bank (DB $13), Germany’s largest bank by assets and the fourth largest in Europe (Statista.com), the greatest risk to the global financial system (Wall Street Journal).

Without diving into the weeds, problems continue to bubble just under the surface with a bank that sports assets of just under $2 trillion.

As onerous as bank bailouts can be, Germany may find itself in the unenviable position of having to stand behind its largest bank. One thing we painfully learned from 2008: once confidence evaporates, a bank is in very big trouble.

I suspect this is not a “Lehman moment,” which is a reference to the disorderly 2008 failure of Lehman Brothers and the subsequent financial crisis. Knowing what we know today and knowing what happens when a large institution collapses, it seems hard to imagine that Germany would allow its largest bank to fold. The economic ramifications for Europe’s largest economy would be overwhelmingly negative.

Today, the European Central Bank has the tools to step in. While new E.U. rules limit taxpayer assistance, it’s not prohibited (Financial Times). That’s not to say that additional problems for Deutsche Bank won’t create short-term volatility at home. It could. But a Lehman moment that creates turmoil in Europe seems unlikely.

A barroom brawl

It’s a tongue-in-cheek way of describing the upcoming election, and I would be remiss if I didn’t address what’s going on. That said, I’ll cautiously tiptoe into a minefield of opinions.

So far, there’s been very little volatility inspired by the upcoming vote. In fact, markets reacted favorably to the first debate when a CNN poll suggested Hillary Clinton bested Donald Trump.

Yet, that remark seems to fly in the face of conventional wisdom. Wouldn’t Wall Street prefer a Republican? Aren’t Republicans the party that favors business and investors? Won’t Trump’s tax policies aid business?

Well, Wall Street also favors certainty over uncertainty, and professional investors see continuity with a Clinton win. Trump’s strong rhetoric fuels passions among his supporters, but it also sparks heightened uncertainty among professional investors. And heightened uncertainty can short-term volatility.

It’s analogous to the idiom, “Better the devil you know than the devil you don’t.”

As your financial advisor and financial confidant, it’s my job to view your investments and strategies through a financial lens, and not spout political ideals when it comes to your financial goals. That said, this is not to be viewed as an endorsement of Clinton or Trump.

Longer term, stocks will take their cues from what happens to the economy and corporate profits. Shorter term, many issues can crop up that either fuel an advance or hinder shares, including a presidential election.

In a nutshell, the long-term trajectory of the U.S. economy is positive, as has been the case for over 200 years. While either candidate may implement policies that help or hinder the economy, U.S. fundamentals remain intact.

Warmest Regards,

Christopher J. Carroll, CIMA®
Founder, Portfolio Manager, and Founding Partner

Share!

It’s OK with us if you would like to share the Market Update with your friends, family and neighbors. We love meeting new folks!

It is important that you do not use this e-mail to request or authorize the purchase or sale of any security or commodity, or to request any other transactions. Any such request, orders or instructions will not be accepted and will not be processed.
All items discussed in this report are for informational purposes only, are not advice of any kind, and are not intended as a solicitation to buy, hold, or sell any securities. Nothing contained herein constitutes tax, legal, insurance, or investment advice.
Stocks and bonds and commodities are not FDIC insured and can fall in value, and any investment information, securities and commodities mentioned in this report may not be suitable for everyone.
U.S. Treasury bonds and Treasury bills are guaranteed by the U.S. government and, if held to maturity, offer a fixed rate of return and guaranteed principal value. U.S. government bonds are issued and guaranteed as to the timely payment of principal and interest by the federal government. Treasury bills are certificates reflecting short-term (less than one year) obligations of the U.S. government.
Past performance is not a guarantee of future performance. Different investments involve different degrees of risk, and there can be no assurance that the future performance of any investment, security, commodity or investment strategy that is referenced will be profitable or be suitable for your portfolio.
The information has been obtained from sources considered to be reliable, but we do not guarantee that the foregoing material is accurate or complete. The information contained in this report does not purport to be a complete description of the securities, markets, or developments referred to in this material. Any information is not a complete summary or statement of all available data necessary for making an investment decision and does not constitute a recommendation.
Before making any investments or making any type of investment decision, please consult with your financial advisor and determine how a security may fit into your investment portfolio, how a decision may affect your financial position and how it may impact your financial goals.
All opinions are subject to change without notice in response to changing market and/or economic conditions.

1 The Dow Jones Industrials Average is an unmanaged index of 30 major companies which cannot be invested into directly. Past performance does not guarantee future results.

2 The NASDAQ Composite is an unmanaged index of companies which cannot be invested into directly. Past performance does not guarantee future results.

3 The S&P 500 Index is an unmanaged index of 500 larger companies which cannot be invested into directly. Past performance does not guarantee future results.

4 The FTSE Developed ex North America Index is an unmanaged index of large and mid-cap stocks providing coverage of developed markets, excluding the US and Canada. It cannot be invested into directly. Past performance does not guarantee future results.

5 New York Mercantile Exchange front-month contract; Prices can and do vary; past performance does not guarantee future results.

6 London Bullion Market Association; gold fixing pricing; Prices can and do vary; past performance does not guarantee future results.

Copyright © 2016 7300 Wealth Management, LLC. All rights reserved.