
MONTHLY FINANCIAL MARKET UPDATE
The summary below is provided for educational purposes only. If you have any thoughts or would like to discuss any other matters, please feel free to contact me.
The Fed and Trade Keep Investors on Their Toes
The Fed and international trade – these are the two headlines that dominated action in Q2.
Longer term, profits and profit forecasts are the leading driver of equities. Shorter term, sentiment can be influenced by various factors.
For much of the year, favorable headlines highlighting progress toward a trade deal between the U.S. and China aided equities. In addition, the Federal Reserve shifted gears, no longer talking about gradual rate hikes.
Coupled with modest economic growth, stocks have performed admirably.
In early May, the rally hit a roadblock when the president tweeted he would impose additional tariffs on China, injecting a new layer of uncertainty into the economic and stock market equation.
An unexpected tweet by the president in early June threatened Mexico with debilitating tariffs.
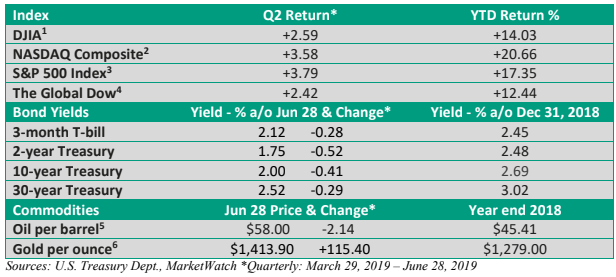
Yet, the peak-to-trough decline in the S&P 500 Index from April 30 thru June 3: a modest 6.8% (St. Louis Federal Reserve data). It’s nothing out of the ordinary.
Since 1980, the average annual maximum peak-to-trough pullback for the S&P 500 Index has been 14% (JP Morgan, LPL Research).
But shortly after Trump threatened Mexico, Fed Chief Powell shifted his stance. No longer was the Fed on hold. Instead, Powell implied the Fed would cut rates if the need arose, sparking a turnaround and lifting the S&P 500 Index to a new high.
The economy and Treasury yields
The steep drop in Treasury yields has surprised nearly everyone – see Figure 1.
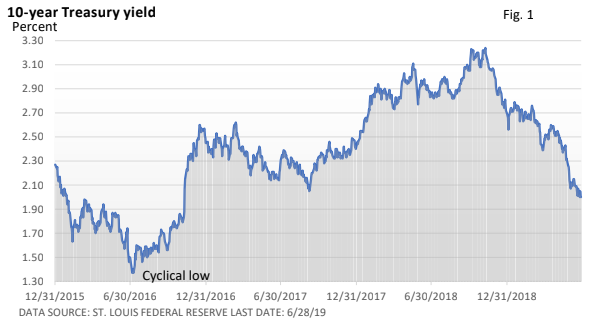
In part, yields have fallen in developed nations, which encourages overseas investors to buy into higher-yielding U.S. Treasuries (bond prices and yields move in opposite direction).
Worries about a protracted trade war have increased economic uncertainty, which has encouraged a flight into safer U.S Treasury bonds.
And, odds of a rate cut or cuts this year have gone up significantly (CME Group FedWatch Tool), which also encourages investors to place cash into Treasury bonds.
If we read the tea leaves, the Treasury bond market is foreshadowing an economic slowdown. The same could be said from the Conference Board’s Leading Economic Index (LEI).
But the LEI isn’t suggesting the economy will contract this year. A quick peek at investment grade debt or yields in high-yield debt (junk bonds) aren’t suggesting a recession either.
You see, junk bonds are sometimes referred to as the canary in the coal mine. If investors expect a steep economic slowdown or recession, yields in junk debt can spike higher as investors flee shakier firms. That’s not happening right now. Investment grade debt can also come under pressure, though we typically see less volatility.
While the rally in stocks during June as not been as broad-based as we might like to see, action in the S&P 500 Index also suggests growth isn’t about to stall.
Rate cuts and stock market reaction
Since 1974, there have been nine rate-cut cycles by the Fed. Figure 2 illustrates the S&P 500’s reaction, from 1-month after to 12-months after the first rate cut in the cycle.
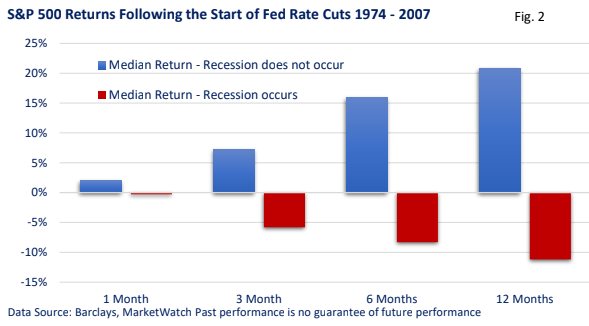
Over the last 45 years, a pattern has emerged, with stocks performing well when the economy side-stepped a recession, such as the mid-1980s, mid-1990s and the late 1990s. When the economy slid into profit-killing recession, rate cuts did little to bolster investor sentiment.
Ultimately, steady economic growth has historically been an important ingredient for stock market gains.