Dog Days of Summer
October has traditionally had a ghoulish reputation for investors. The stock market crash of 1929 and 1987 happened in October. While not a one- or two-day event, the S&P 500 Index shed nearly 17% during 2008, per S&P 500 data from the St. Louis Federal Reserve.
But reputations don’t always square with reality.
Monthly average returns for the S&P 500 Index are reflected in Figure 1. The blue category represents average monthly changes from 1970 to the present, while the red category reflects data from 2010 to the present (through August 2023).
October has historically been a positive month for the market. Since 2010, the S&P 500 Index has been the second-best performing month.
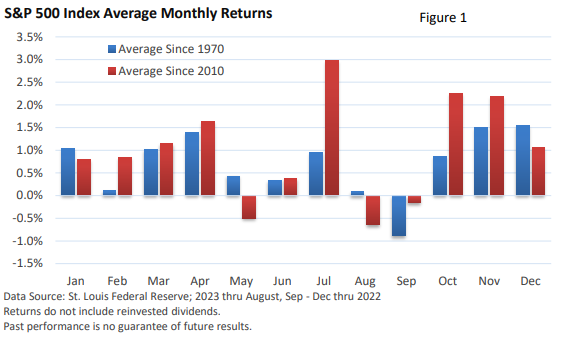
August and September, however, have historically been lackluster months. On average, September has historically been the worst-performing month, with August not far behind.
Over a short period of time, we might expect wide monthly variations. Over a longer period, however, we’d expect those variations to narrow considerably. That’s not been the case.
We get that certain industries experience seasonal fluctuations. For instance, retailers experience increased business during the holiday season. Similarly, ski resorts and outdoor water parks depend on winter and summer for their revenues.
However, experts have struggled to explain monthly stock market variations, including relative weakness in August and September.
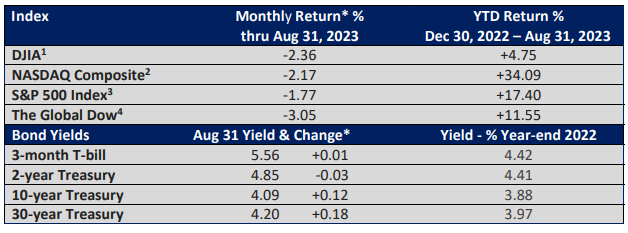
Keeping with the historical pattern, the upbeat market performance this year was interrupted in August, with the S&P 500 Index losing 1.77%.
While it is difficult to pinpoint the reason behind long-term sluggishness in August and September, we can provide a more specific explanation for last month’s underperformance. The S&P 500 is well off last year’s bottom. When stocks rally sharply and are seemingly priced for perfection, any uncertainty may create a good excuse for short-term traders to book profits.
For starters, China, the world’s second-largest economy, was supposed to rebound this year following draconian lockdowns last year. Instead, it has been struggling to gain momentum.
Most people won’t be directly affected by what happens in China, but the weakness in the country’s economy can trickle into stocks since many major corporations rely on the country as a source of revenue.
Next, the Federal Reserve’s bark last year was as vicious as its bite. While the Fed continues its verbal assault against inflation, the pace of rate hikes in 2023 has slowed significantly.
However, the U.S. Treasury is ramping up debt issuance, and a strong Q3 start for the U.S. economy helped push the 10-year yield to its highest level since late 2007, according to U.S. Treasury data.
All else equal, higher bond yields create more competition for stocks.
Finally, as we’ve discussed, headwinds came at a time when seasonality sometimes pressures equities. Since 2010, on average, August is the worst-performing month (Figure 1). Since 1970, average performance ranks second from the bottom (Figure 1).
Final thoughts
Since 1970, September has been the only month with a negative average return. However, this does not guarantee that the month that marks the beginning of fall will finish lower.
Since 2010, the S&P 500 has finished higher six times in September, including an 8.8% rise in 2010. August has also advanced six times.
While exercises that pinpoint general seasonal patterns make for an interesting discussion (and help explain last month’s lackluster market return), we know that market timing and implementing strategies based on timing aren’t a realistic approach.
So, control what you can control. You cannot control returns. What you can control is behavior, time in the market, and the amount of risk you take. These variables help us develop a holistic approach to your financial plan.
It’s one more reminder that successful long-term investors recognize that a disciplined approach has historically been the shortest path to reaching one’s financial objectives.