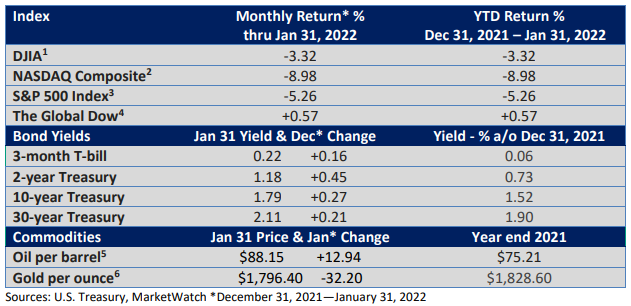
January’s Rocky Start
January was an uncertain month for investors. It didn’t take long for a more aggressive stance by the Federal Reserve to inject volatility into the market. But does the first month set the tempo for the rest of the year? Before we delve into the “what and why,” let’s look at what is popularly known as the January barometer.
The January barometer suggests that the performance of the S&P 500 Index in January foreshadows the performance for the rest of the year. But does it really work?
Since 1945, the January barometer has held true roughly 75% of the time when January was positive, according to Fidelity Investments. That is to say, in most cases, an up January has led to an up year.
One reason may be fairly simple: the historical proclivity of stocks to rise. However, what happens when January finishes in the red, as we saw last month? Well, the answer is less clear.
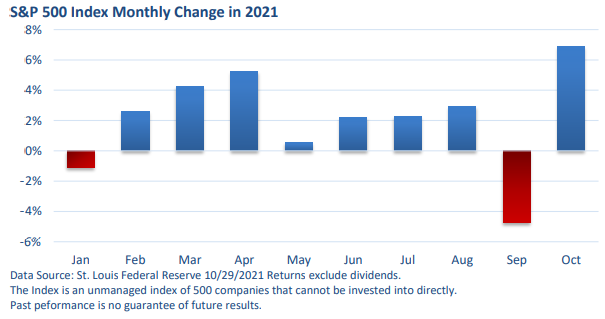
Going back to 1950, in 14 out of 28 years when January ended lower, the stock market gained ground during the year, sometimes by a very substantial amount. That was the case in 2020 and 2021.
Of course, what happens in the past does not always correctly predict what will happen in the future. There are much more important fundamental factors, including profits, the economy, monetary policy, interest rates, and more.
The Fed—no more Mr. Nice Guy
Last year’s kinder and gentler Federal Reserve has been replaced by a Fed that is rattling its saber. It’s a far cry from a year ago when Fed Chief Powell suggested there would be no rate hikes through at least 2023.
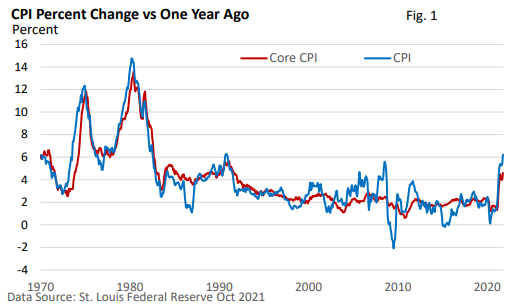
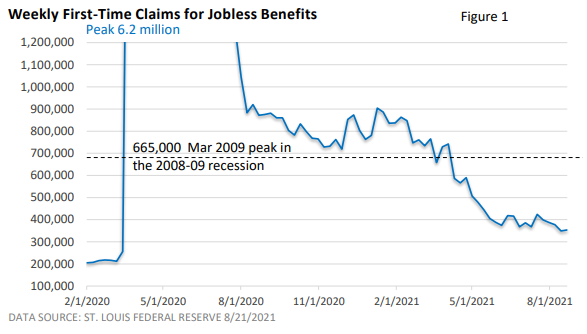
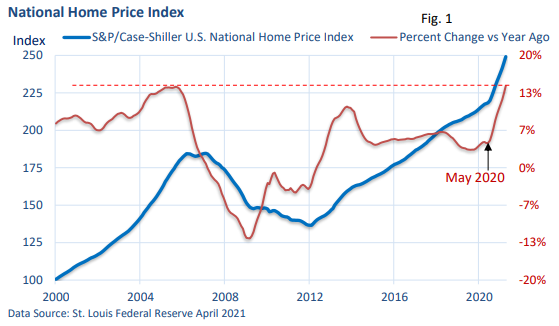
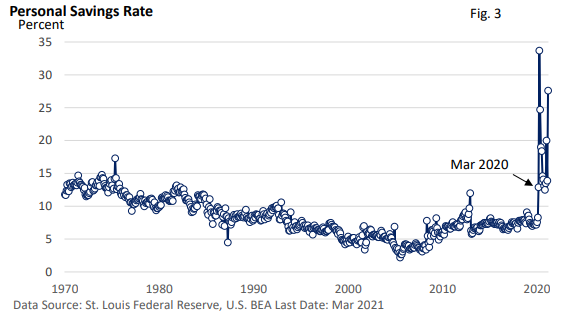
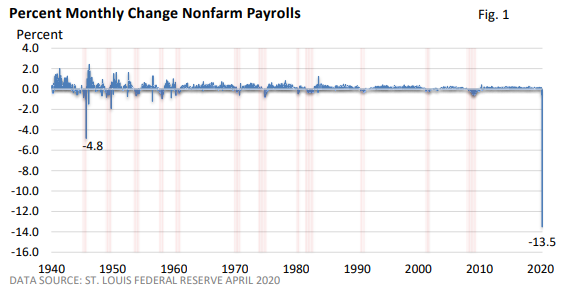
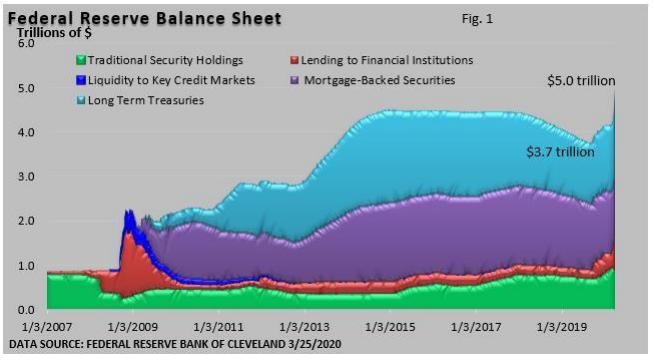
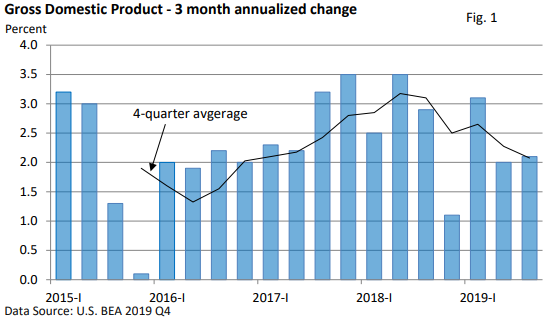
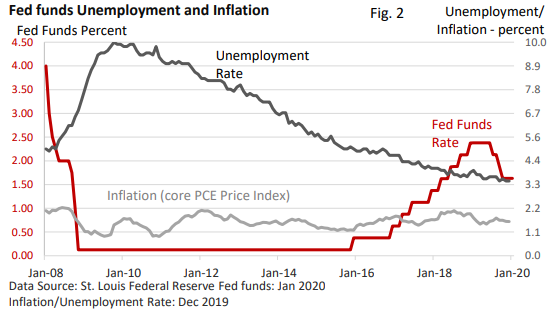
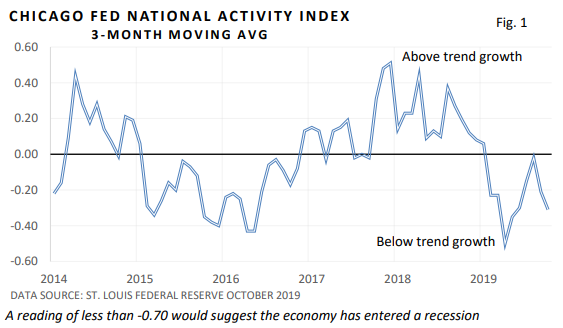
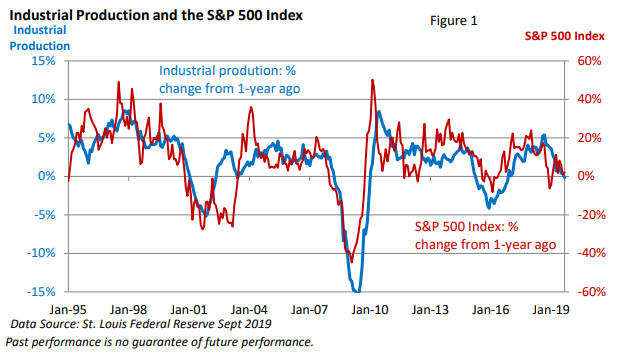
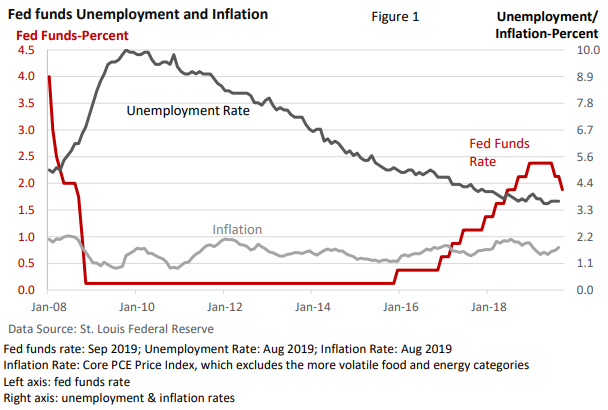
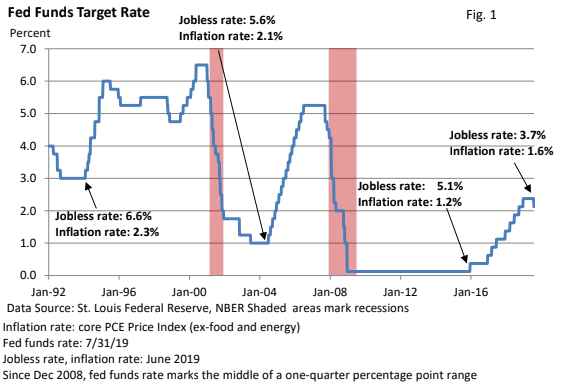
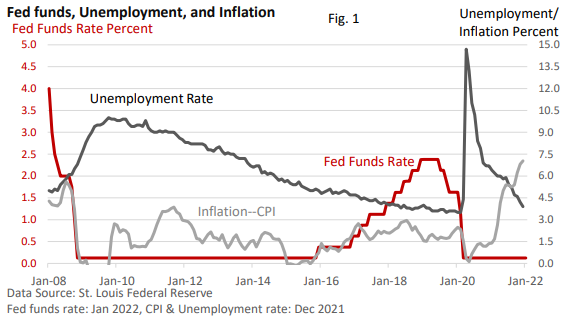
Figure 1 illustrates the Fed has been much more patient this time around. In the last cycle, it began a gradual series of rate hikes in 2015 when inflation was low, and the jobless rate was 5.0%. Today, the Fed is behind the inflation curve and strongly hinted it would like to catchup.
But trying to rein in inflation without causing an economic hard landing could be a challenge.
In December, the Fed’s own Economic Projections suggested three, ¼ percentage-point rate hikes in 2022. In early January, several Fed officials suggested at least four. By month’s end, Fed Chief Powell wouldn’t rule out the possibility of one rate hike per meeting (there are eight schedule meetings each year; January was the first).
Nearly all observers expect the first rate increase to occur in March.
How might rising interest rates slow inflation? The Fed sees higher interest rates as a way to put the brakes on faster economic growth, slow overall demand, and take pressure off prices.
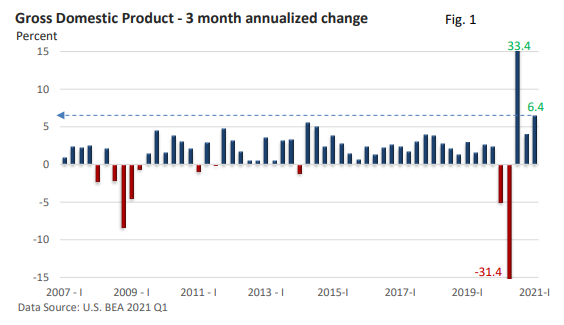
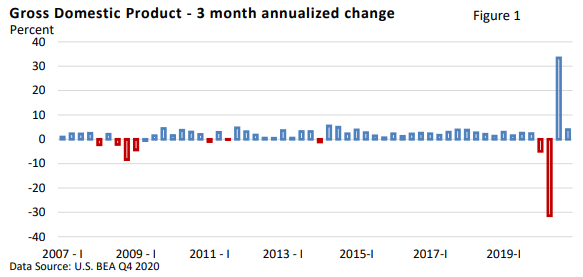
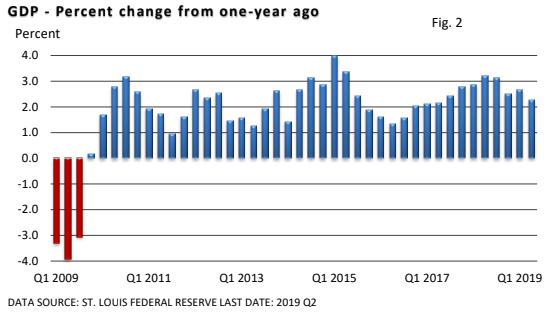
The economy ended the year with an annualized growth rate of 6.9% in the fourth quarter, according to the U.S. BEA. Last year, three of the four quarters saw economic growth north of 6%. That’s impressive.
Strong economic growth lowered the jobless rate to 3.9% as of December, per the U.S. BLS. Further, significant labor shortages in some industries are pushing up wages while supply chain disruptions are exacerbating inflation. Wage hikes are great for workers, but they can also lead to higher prices.
As we enter February, investors are attempting to price in higher interest rates, which could offer stiffer competition to stocks. However, economic growth supports higher profits, which aid stocks. It’s akin to an economic tug of war.
Expecting volatility
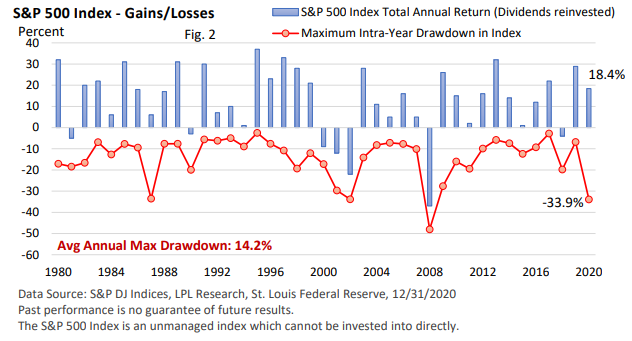
If we travel back 100 years, we’d find that volatility is the norm. According to CNBC, the average intra-year peak to trough in the stock market going back to 1928 was 16.5%. In 59 of 94 years, intra-year losses were in excess of 10%. In 24 of the 94 years, losses topped 20%. Yet, in most cases, stocks finished the year higher.
Since 1921, the Dow posted an annual advance 70% of the time, per Trading Investment. What unnerves some investors is the idea that stocks seem to take the stairs up and the elevator down.
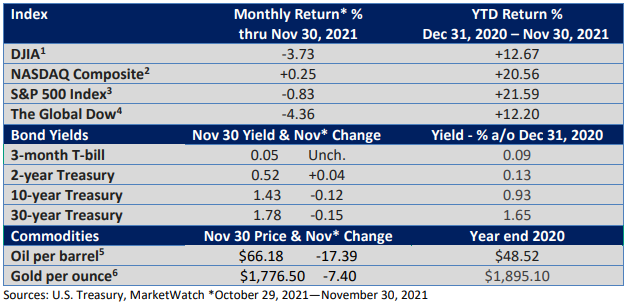
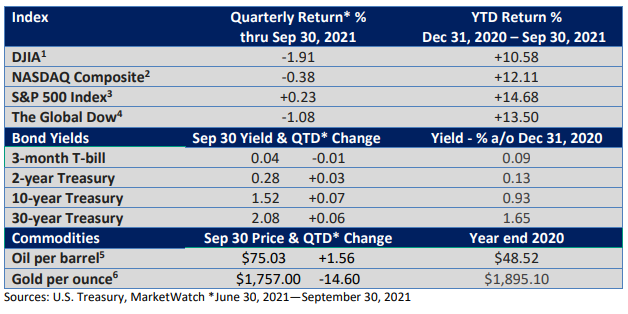
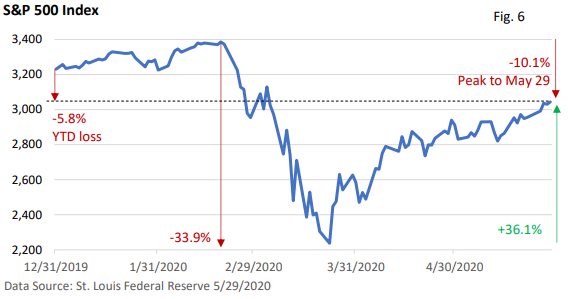
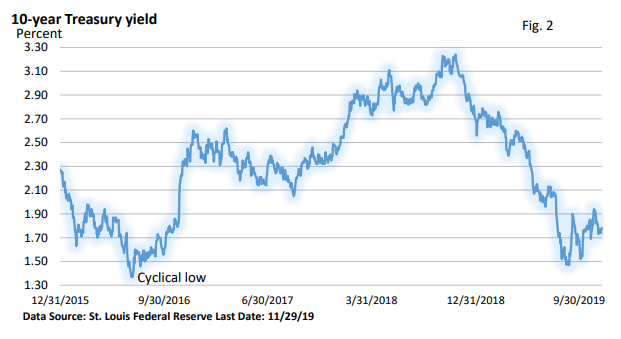
Since peaking early in the year, the S&P 500 Index’s peak-to-trough decline was 9.8%, according to St. Louis Federal Reserve data. It’s just shy of an official correction of 10%. The decline in the tech-heavy Nasdaq was more pronounced.
And, according to the Wall Street Journal, speculative and unprofitable firms have been hit the hardest. To paraphrase Warren Buffett, you find out whose swimming without clothes when the tide goes out.
As we’ve cautioned in the past, making investment decisions based on market action is rarely profitable. A disciplined approach based on one’s long-term goals has historically been the straightest path to reaching one’s financial goals.
Circumstances change. We understand that. If that’s the case, let’s talk. We’re only a phone call away.