Broker Check

7300 Wealth Connect – March 2024

Inflation Makes a Play, Investors Ignore

Just when you thought it was safe to go back into the department store, inflation surprised to the upside last month!

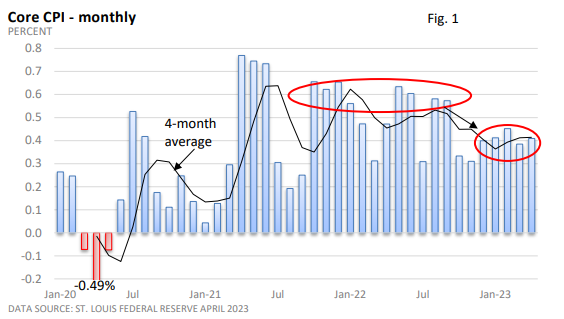
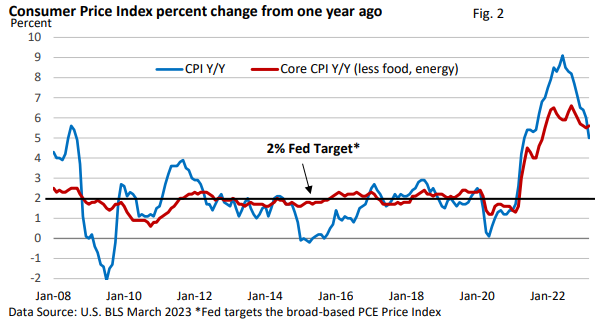
As reported in mid-February, the Consumer Price Index(CPI) rose 0.3% in January, and the core CPI, which minuses out food and energy, rose 0.4% per the U.S. Bureau of Labor Statistics.

According to the Wall Street Journal, both measures topped expectations by 0.1%. On an annual basis, the CPI is up 3.1% and the core CPI is up 3.9%. Neither comes close to the Federal Reserve’s definition of price stability, which it characterizes as a 2% annual rate.

Inflation had been moving in the right direction, and January is a reminder that unwanted surprises are to be expected.

Why focus on core inflation?

Groceries and energy are a big part of the cost of living. Besides, the CPI is lower today when food and energy are included.

Food and energy can be volatile. So, economists like focusing on the core rate as it provides a better picture of underlying inflation trends.

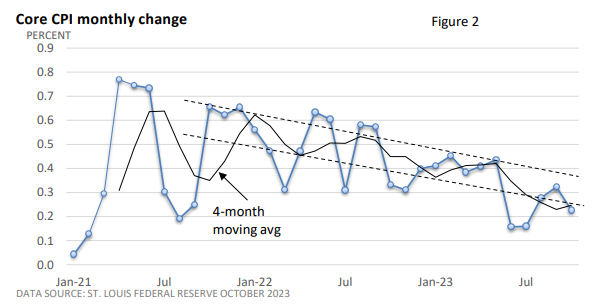
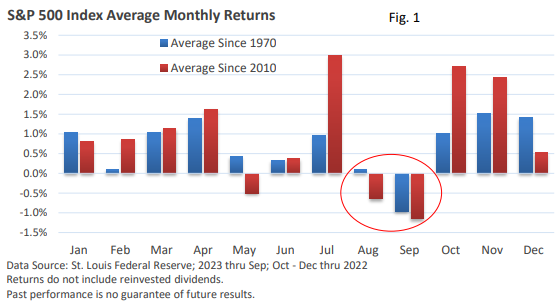
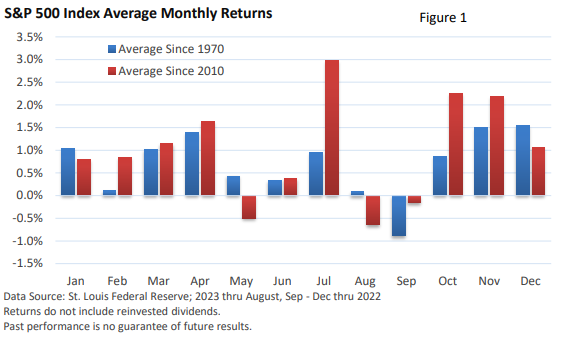
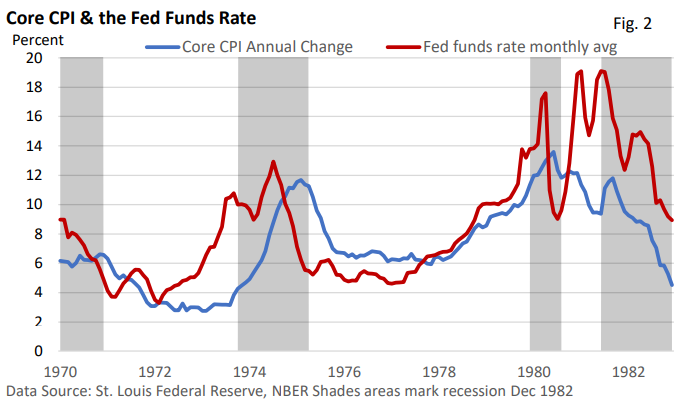
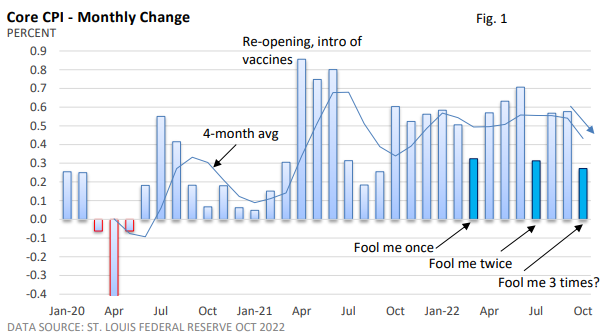
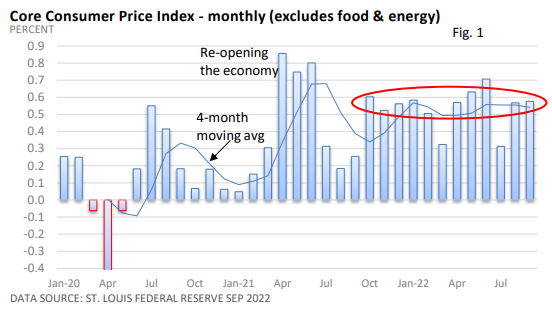
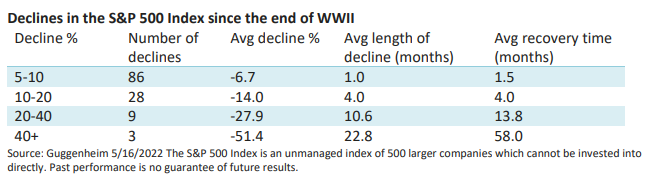
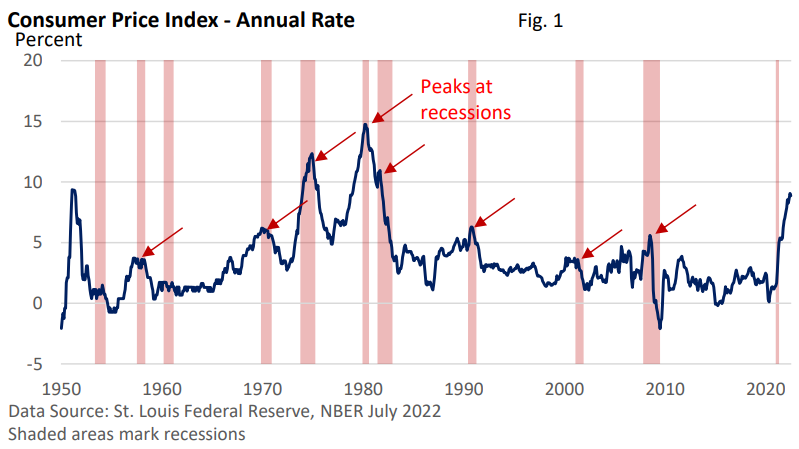
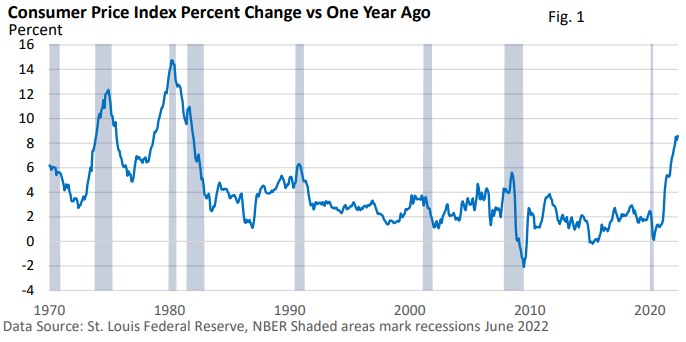
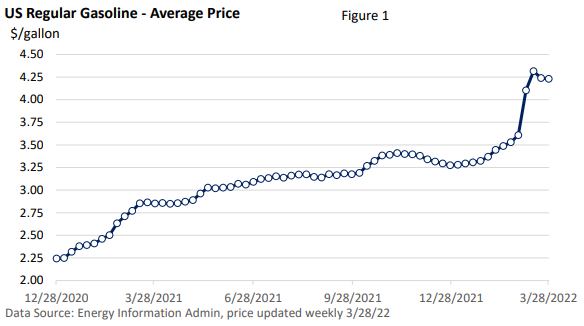
As Figure 1 illustrates, inflation rose at its fastest pace since April. More recently, progress toward a more stable price level has stalled, and the rate has ticked higher.

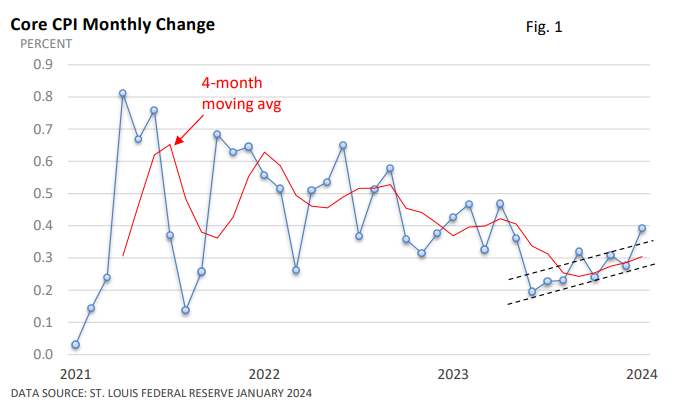
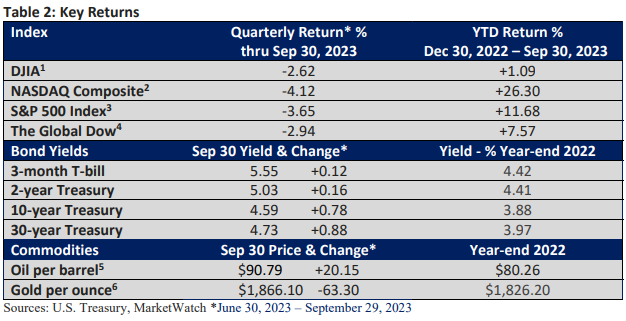
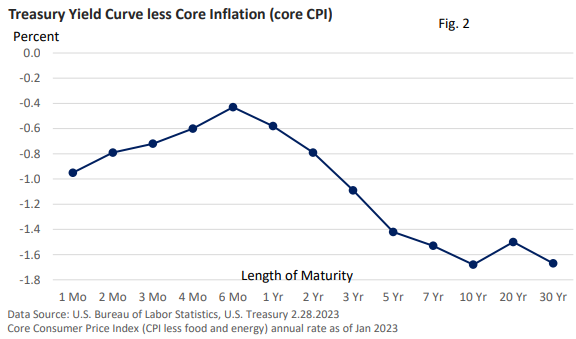
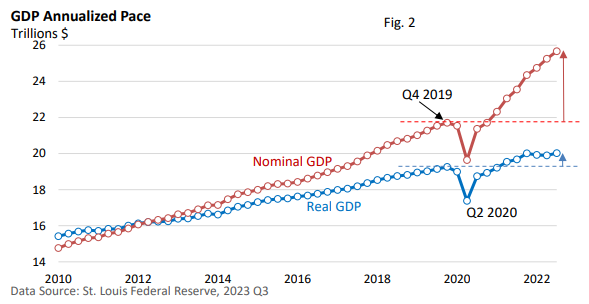
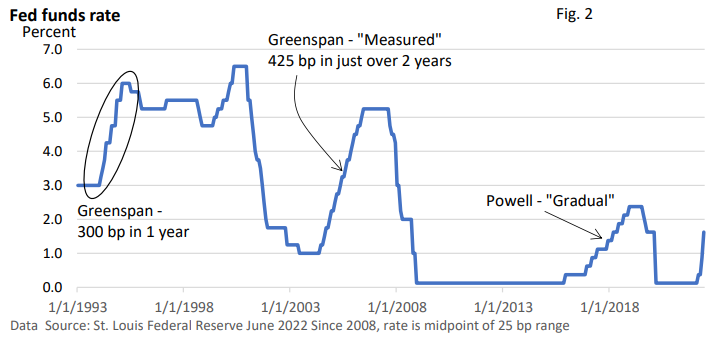
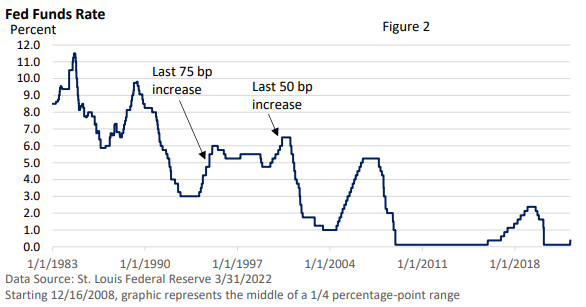
Figure 2 highlights what’s under the hood.

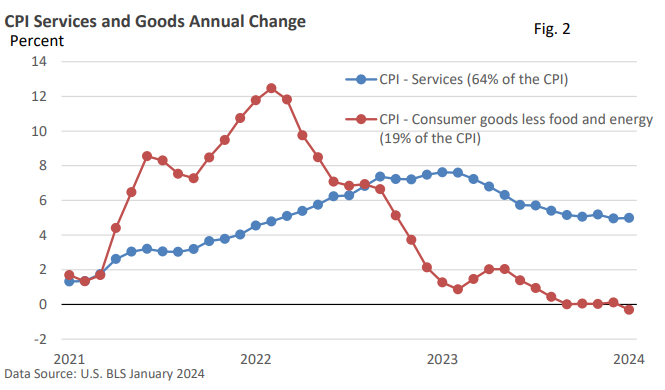
In 2021, the price of consumer goods jumped amid supply chain woes, super-low interest rates, and government payments to families and individuals that flowed into consumer goods. But a much-improved supply chain has eased bottlenecks, and prices for goods have stabilized.

Services, however, are much stickier and are stuck near 5%.

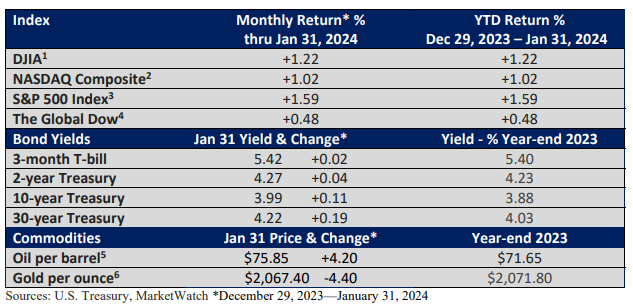
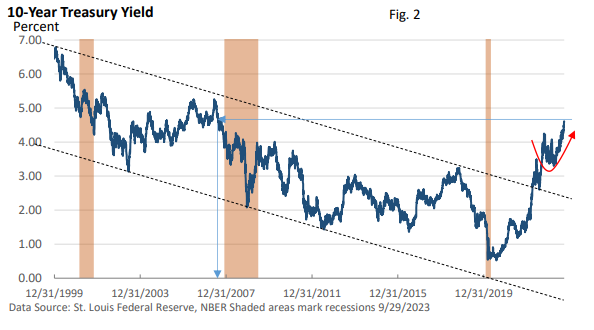
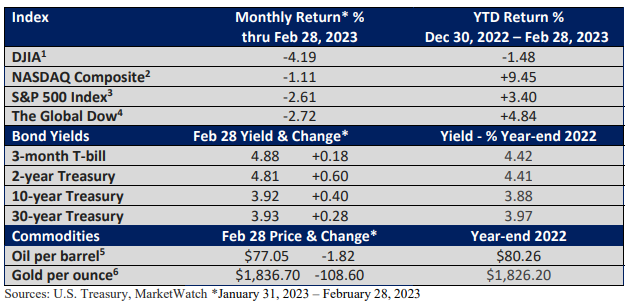
Investors side-stepped inflation worries last month

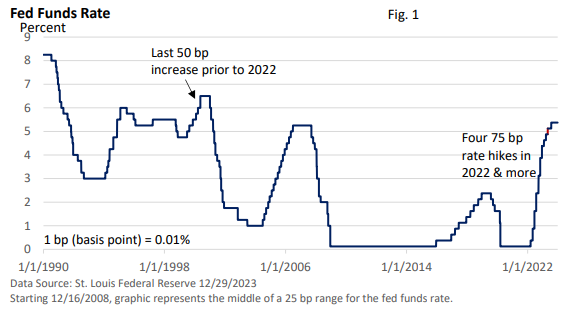
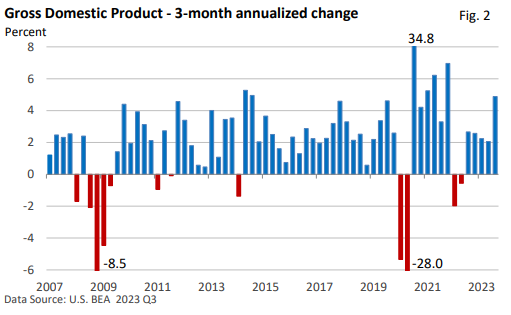
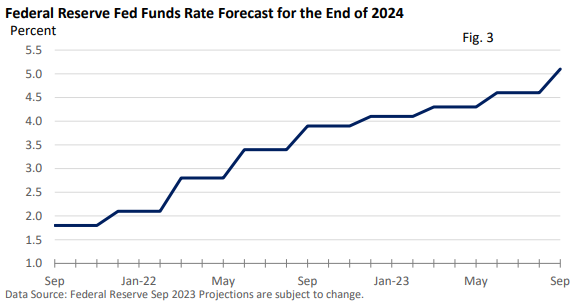
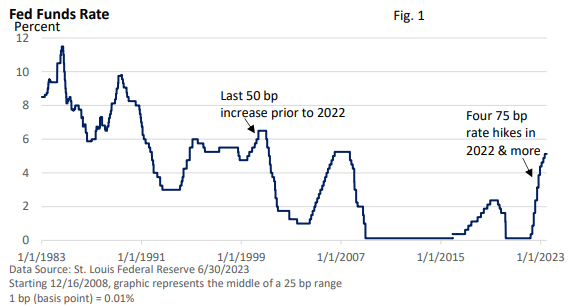
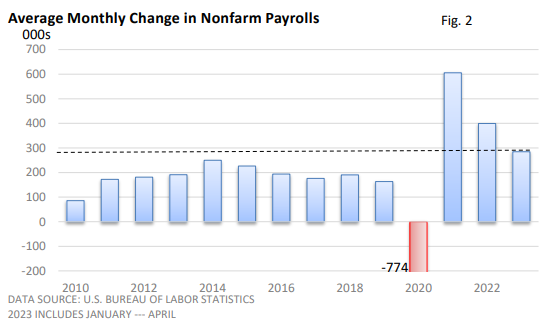
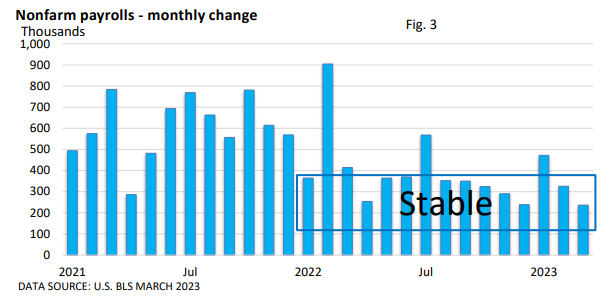
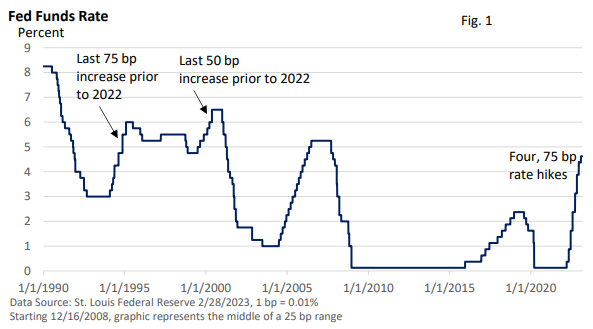
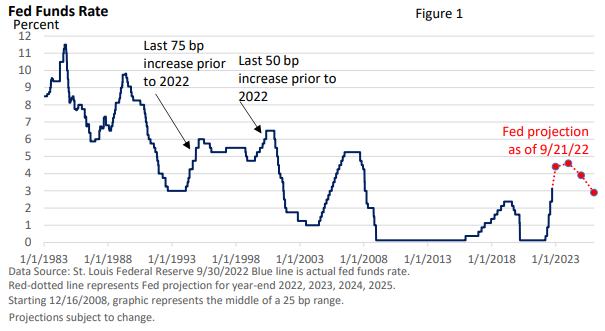
A strong January employment report, coupled with a lack of progress in inflation, threw cold water on talk of a March rate cut by the Fed.

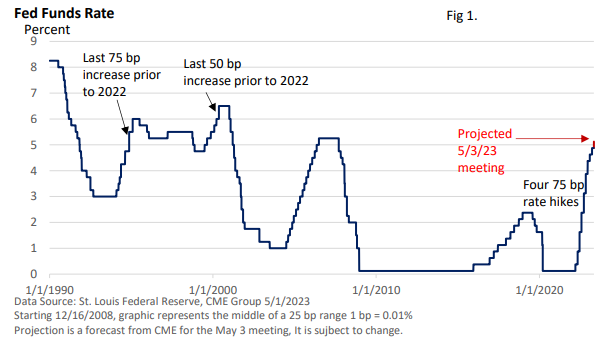
One key measure from the CME Group now projects three quarter-point rate cuts this year versus six or seven in January. That is a considerable difference.

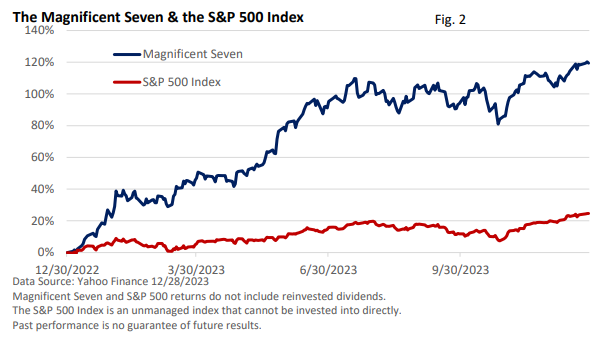
Nonetheless, a more moderate path did little to dampen enthusiasm for stocks last month.

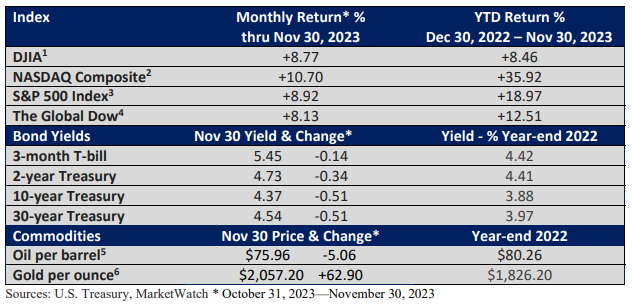
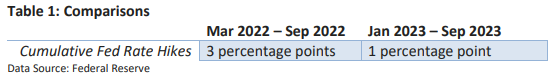
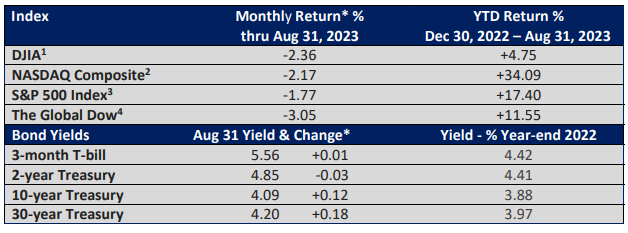
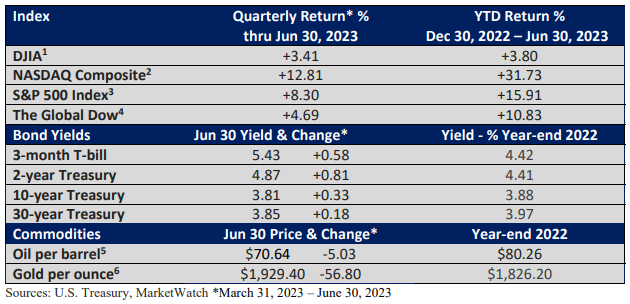
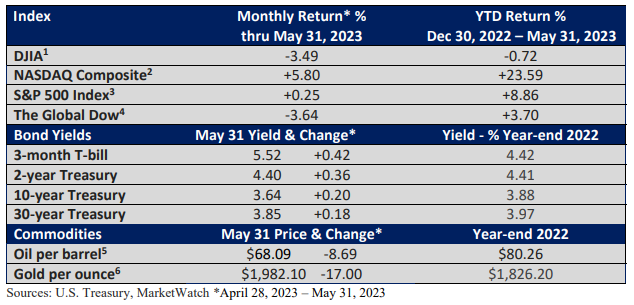
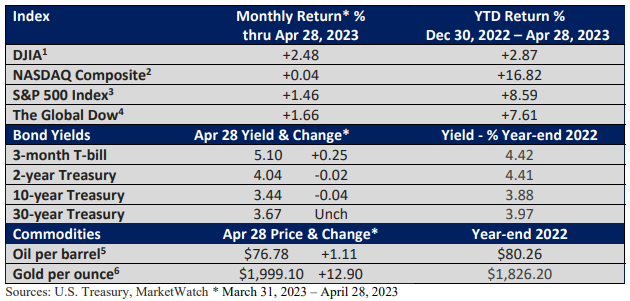
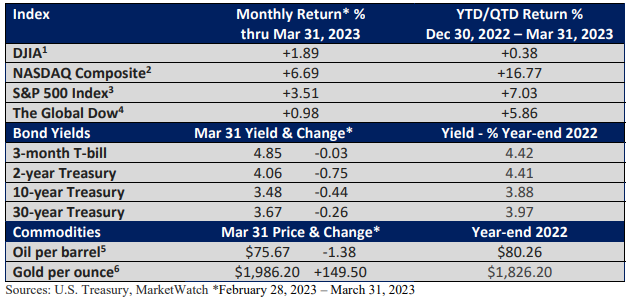
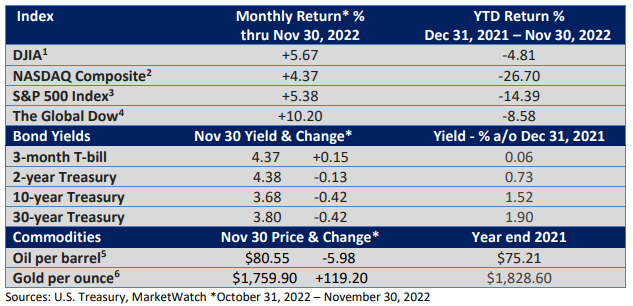
The S&P 500 Index and the Dow Jones Industrials set new highs late in the month, and the Nasdaq Composite closed at a new high at month’s end, eclipsing its previous high over two years ago (MarketWatch data).

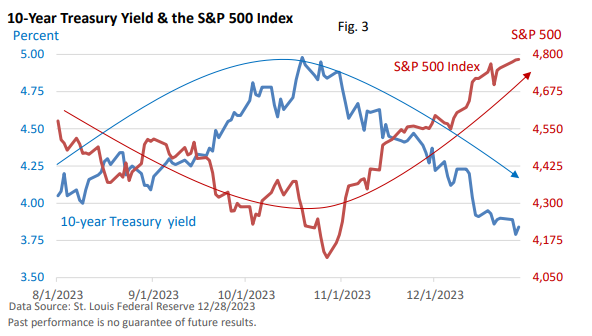
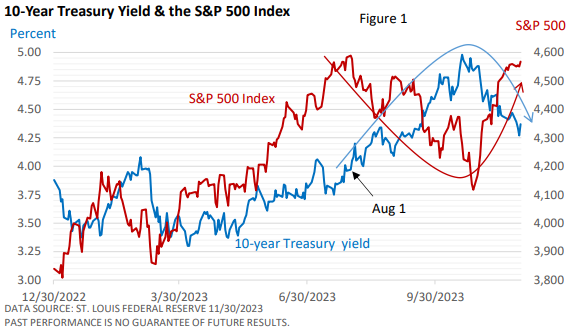
Credit a growing economy, rising corporate profits, and an appetite for AI-related stocks among investors. Notably, stocks pushed higher even as bond yields rose last month.

Yet, according to Bloomberg News, a few investors are starting to factor in a possible rate hike or hikes this year as the Fed struggles to steer the economy toward a soft landing.

Because rate increases aren’t expected this year, any talk of further tightening by Fed officials, if it were to surface, would likely create some volatility.

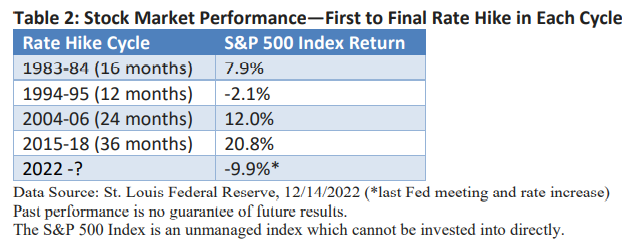
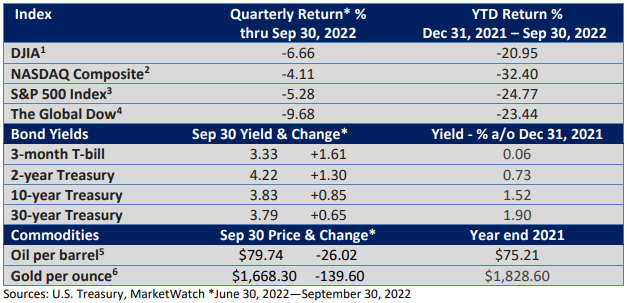
But, as the table below suggests, rate cuts alone don’t fuel market gains when the reductions are in reaction to a recession.

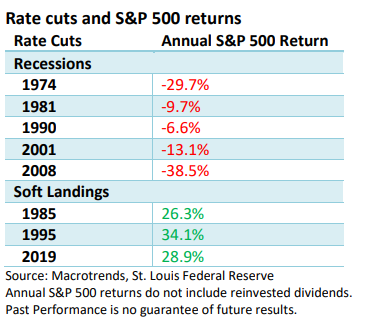
In contrast, profit growth typically accompanies the soft-landing scenario that avoids a recession. In that case, lower interest rates and rising profits have historically aided stocks.

But any benefit from falling interest rates that coincide with a recession has historically been offset by stiff headwinds from falling profits, which is typical of a recession.

Final thoughts

Perhaps the 0.4% rise in the core CPI was an aberration tied to the calendar. Some firms may see January as a good time to hike prices. You know, turn the page on the calendar, raise prices. Or, price hikes come in response to annual wage hikes. We’ve seen it before.

Besides, the road to price stability was never going to be a straight line. Sometimes, you expect a zig, and instead, it zags.

Unfortunately, the recent trend highlights more zags than zigs, as illustrated in Figure 1. That suggests the last mile to price stability may be the hardest.

Yet, that didn’t discourage investors last month.

Please let me know if you have questions or would like to discuss any other matters.

7300 Wealth Connect – February 2024

As January Goes, So Goes the Year… or Does It?

The January Barometer is a tool that attempts to predict the annual market performance based on how an index performs in January. For example, the S&P 500 Index returned 6.2% in January 2023. For the year, the S&P 500 Index advanced 24.2% (Note: data on S&P 500 returns exclude reinvested dividends. Data gathered from the St. Louis Federal Reserve).

Last year was a ringing endorsement for the January barometer. But was 2023 an exception? Let’s dive in and take a look.

Since 1970, the S&P 500 in January advanced 57% of the time. On the flip side, January was down 43% of the time. The broad-based S&P 500 finished the year in the green 75% of the time. That doesn’t tell us much, so let’s dig deeper.

When the S&P 500 was positive in January, the index finished the year higher 87% of the time. Last month, the S&P 500 advanced 1.59%.

When January ends in the red, it doesn’t necessarily mean the S&P 500 will end the year lower. Historically, the S&P 500 registered an annual loss 43% of the time.

The verdict

Is there really something to the January barometer? Well, the best answer is probably yes and no.

Yes, perhaps because the market has a propensity to rise over time. So, a positive start to the year and an upward bias suggest that prospects are favorable.

Additionally, a positive start could be viewed as a head start. ‘Team S&P 500’ takes an early lead, and the bears are at a disadvantage heading into the rest of the year.

Even when January finishes lower, the odds still favor a positive finish. But with ‘Team Bear’ taking an early lead, the bulls are forced to overcome an early deficit, and the odds of a winning year are lower.

No, because what is happening to stocks in January may have little bearing later in the year. Bottom line—the January Barometer has historically favored a positive year when the market starts strong. Nonetheless, a negative start doesn’t necessarily signal a weak year.

Yet, please be mindful that past performance does not guarantee what will happen in the future, including 2024. Historically, the economic fundamentals influence market performance over a longer period.

In 2022, soaring interest rates and high inflation tipped the balance in favor of bearish sentiment. In 2023, stocks turned higher as the Fed significantly slowed the pace of rate hikes, inflation slowed, and the economy avoided a profit-killing recession.

A respectable start & a new high

Optimism Abounds… This New Year, the Wall Street Journal said on January 1. November and December treated investors quite well, and sentiment was extremely favorable.

Yet, the year started with a modest degree of uncertainty. It’s not that we saw a big pullback. On the contrary, the dip was very modest. It may have simply been tied to investors who decided to take profits in tax year 2024 rather than in December.

But optimism about the economy and interest rates helped the S&P 500 Index reach new highs in January, surpassing the previous high set two years ago.

Today, the Federal Reserve is openly talking about cutting rates. How many reductions, assuming they take place, is unclear. But in December, the Fed’s own Summary of Economic Projections indicated three quarter-point rate cuts in 2024.

On January 31, Fed Chief Jay Powell tamped down on enthusiasm for a March rate cut, which encouraged a selloff on the last day of the month. But a May or June rate cut can’t be ruled out.

More importantly, the economy continues to expand at a moderate pace. While backward-looking (October – December), Gross Domestic Product (GDP), which is the largest measure of economic activity, expanded at a solid clip, up at an annual pace of 3.3% in Q4

Faster economic growth reduces the odds of Fed rate cuts as there is less pressure for the Fed to stimulate economic activity.

As Powell framed it, barring an unexpected slowdown in the economy, the timing of rate cuts will be linked to how quickly inflation is returning to the Fed’s annual goal of 2%. Put another way, the debate is now centered around ‘when’ not ‘if’ on interest rates.

Still, economic growth supports corporate earnings, albeit unevenly. While investors may not see an aggressive rate-cutting cycle in 2024 (much will depend on the economy), a reduction in interest rates, coupled with modest economic growth, has historically been supportive of stocks.

Please let me know if you have questions or would like to discuss any other matters.

7300 Wealth Connect – January 2024

The Blockbuster Year Few Expected

A Wall Street Journal article titled “What Did Wall Street Get Right About Markets This Year? Not Much” did a good job summarizing the year.

In December 2022, Moody’s Chief Economist Mark Zandi captured the prevailing sentiment at the time.

“Usually, recessions sneak up on us. CEOs never talk about recessions,” Zandi said. “Now it seems CEOs are falling over themselves to say we’re falling into a recession. … Every person on TV says recession. Every economist says recession. I’ve never seen anything like it.”

In the absence of a profit-killing recession, a moderation in Fed rate hikes and a growing interest in artificial intelligence pushed the Dow Jones Industrials to a new all-time high, while the S&P 500 Index ended the year just shy of a record. Concerns about potential market disruptions following the failure of Silicon Valley Bank were unfounded.

Recession MIA

Projecting turning points in any economic cycle is difficult, and it’s not unusual for economists to miss their targets.

Economic models are complex, and each cycle has its own unique characteristics. Only in hindsight do we usually identify them. Without the foresight to recognize the emergence of new economic influences, economic forecasting models can provide false signals.

The Fed shifts its stance

The economic story of 2022 was high inflation and sharply higher interest rates. Both punished stocks. Last year, the rate of inflation began to slow, and the Fed adjusted its response, raising rates by a total of one percentage point compared to 4.25 percentage points in 2022 – Figure 1.

Rate hikes are probably over. While forecasts can change, the Fed projected a total of 75 bp in rate cuts this year when it released its quarterly Economic Projections in December.

The Magnificent Seven

Not all rallies are created equally.

Coined the “Magnificent Seven” by a Bank of America analyst, Microsoft (MSFT), Amazon (AMZN), Meta Platforms (META, formerly Facebook), Apple (AAPL), Alphabet (GOOG, formerly Google), Nvidia (NVDA), and Tesla (TSLA) significantly outperformed as Figure 2 illustrates.

Collectively, they account for about 30% of the performance of the S&P 500 Index, according to the Wall Street Journal (as of December 17, 2023). Excluding those seven stocks, the S&P 500’s advance would have been roughly half, according to the Wall Street Journal.

Yields turn the wheels

Figure 3 demonstrates that bond yields have played a crucial role in driving the stock market over the past five months. As yields increased from August into late October, the S&P 500 Index pulled back about 10%. Following the peak in yields, the market rallied.

Over time, however, these correlations usually break down. Treasuries are sometimes viewed as a safe haven in times of economic uncertainty. Treasury bond prices and yields move in the opposite direction, so falling yields simply mean bond prices are rising.

If yields decline too quickly, investors may start to fret over a potential economic slowdown, creating headwinds for stocks.

The preferred scenario for investors is one where economic growth is slow enough to keep inflation in check but not so slow as to noticeably hamper corporate profit growth.

This would likely allow the Fed to slowly reduce rates because it “can,” not because the economy slips into a recession and it “must.”

A New Year

We have access to the brightest minds on Wall Street. But is it always wise to seek their counsel? At the end of 2022, many strategists were pessimistic about the upcoming year of 2023. Analysts, on average, were predicting a small decline of about 2% in the S&P 500 Index, according to Bloomberg.

2023 wasn’t the first time the consensus was wrong, nor was it a rare miss. The median annual Wall Street forecast between 2000 – 2020 missed the mark by an average of 12.9 percentage points (CNBC/NY Times).

Notably, last year was the first time that analysts predicted a market decline during the 2000s. Over the long term, stocks have a solid track record, but progress is uneven. Downturns are to be expected. According to data from Macrotrends, the S&P 500 Index (excluding reinvested dividends) has finished lower seven times since 1999.

Market weakness was predicated on a 2023 recession that failed to materialize. However, let’s not completely discount commentary. Strategists bring unique observations to our attention. We are better informed due to their diligence and insights.

They really are brilliant men and women. But they grapple with the unknown, and no one knows precisely how the future will unfold.

Yet, the unknown encourages us to get comfortable with some degree of risk. It allows us to become better and more disciplined investors.

Figure 4 highlights that stocks have a long-term upward trend, and long-term investment plans are customized to participate in that trend, but pullbacks are common.

Last year, the S&P 500 posted a return of 26% (blue bar, including reinvested dividends). During the period, the maximum pullback was 10% (red dot) – Figure 4.

Since 1980, the S&P 500 Index finished higher 82% of the time. When the index ended the year in positive territory, the average gain was 19%. When the index finished lower, the average loss was 13%.

As we bid farewell to 2023, may the New Year bring you excitement, adventure, fulfillment, and prosperity.

7300 Wealth Connect – December 2023

Bond Reversal Powers November Advance

Many things influence the direction of stocks. Corporate profits, economic growth, general market sentiment, inflation, and interest rates are among those variables.

At any given point, the influence of various factors on stocks will fluctuate. In 2022, investors were predominantly concerned about the Fed’s efforts to combat inflation.

As the year began, the Fed slowed the pace of rate increases and a much-anticipated recession has been slow to materialize.

As August approached, the 10-year Treasury yield broke past 4%, creating challenges for investors. But Figure 1 isn’t simply about bonds. Since August there has been a steep inverse correlation between stocks and yields. Note that the yield peaked near the recent low (October 27th) for the S&P 500 Index.

Between August 1 and November 30, the correlation between the 10-year yield and the S&P 500 has been -0.79, where a correlation of +1.0 would mean the yield and the index move together and -1.0 would mean the yield and the index move in opposite directions.

For investors who hold a well-diversified portfolio of stocks and bonds, it has been a win-win since yields and bond prices move in the opposite direction.

The longer the term to maturity, the greater the upward or downward move in bond prices when yields fall or rise (all else equal). For example, given the same decline in the yield on the 2-year and the 10-year Treasury, we’d see a greater price appreciation in the 10-year bond.

Why have we seen a reversal in sentiment for bonds? After a strong third quarter for the economy, economic uncertainty is creating some interest in Treasury bonds.

A more cautious approach by the Federal Reserve is also playing a role. While the Federal Reserve has not shut the door on additional rate hikes, it’s looking increasingly like the Fed’s rate-hike campaign may be over.

At his November 1 press conference, Fed Chief Powell said the Fed is “proceeding carefully” four times, as policymakers aim to slow the rate of inflation without a significant rise in the jobless rate.

That’s a significant shift from a year ago when the Fed was aggressively raising interest rates.

Yet, the Fed doesn’t always get it right. It missed the surge in inflation and was forced to play catchup. Earlier this year, the Fed openly talked about a possible recession but has since removed it from its forecast.

Still, a good portion of its optimism is rooted in the slowdown in inflation.

The core Consumer Price Index (CPI), which excludes food and energy, has gradually eased. Though it remains too high, we’re seeing progress amid a slowdown in the rate of inflation— see Figure 2.

But don’t expect prices to return to pre-pandemic levels.

Since January 2020, the CPI is up 19% through October 2023 (latest data available), according to the St. Louis Federal Reserve. The Fed’s stated goal is to slow the annual rate of inflation to 2%, not return prices to pre-pandemic levels.

As of October, the core CPI is running at 4.0% annually and the CPI is at 3.2% annually.

While consumers want lower prices, the bar for investors is lower—a continued slowdown in inflation. It gets trickier when you mix in milder economic growth without a recession, or at worst, a very mild recession.

Both would further cement the idea that the rate-hike cycle is over. But might we soon see a reduction in interest rates?

Investors have repeatedly front-run rate cuts that failed to materialize. However, milder inflation and slower economic growth would raise the odds of a cut in interest rates.

7300 Wealth Connect – November 2023

Eyes on Bond Yields

The month of October has a reputation for significant stock market turbulence, such as the Crash of 1929 and 1987. The 2008 financial crisis also sparked a big selloff in October.

While trading on a daily basis can be volatile, the month historically finishes in the green.

On average, since 2010, October has been the second-best performing month for the S&P 500 Index per data from the St. Louis Federal Reserve.

Since 1970, October is tied for fourth place. That favorable trend, however, broke down this year.

The main reason for last month’s setback was rising pressure on Treasury bond yields. In particular, the 10-year Treasury yield briefly reached 5%, the highest level since 2007 (CNBC).

It’s not that the Federal Reserve is threatening another extended series of rate hikes. But the Fed continues to insist that the fed funds rates will remain at a higher level for a longer period.

That is playing a role in the upward march of bond yields, as illustrated in Figure 1. Figure 1 plots the yield of Treasuries as of September 29 and October 31, with maturities ranging from one month to 30 years.

The Fed’s recent hesitation in lifting the Fed funds rate is keeping shorter-term yields in check. Its insistence that the fed funds rate will remain higher for longer, as it hopes to snuff out inflation, is one reason longer-term yields are rising.

Additionally, the rising federal deficit is forcing the Treasury Department to issue new bonds to finance the deficit, which is putting some pressure on yields, too.

In addition, economic activity, which was expected to slow in Q3, accelerated sharply amid a spurt in consumer spending—see Figure 2.

Gross Domestic Product (GDP), the largest measure of the value of goods and services in the economy, expanded at an annual pace of 4.9% in Q3—see Figure 2.

It’s hard to pinpoint why the consumer suddenly came alive. It seems unlikely that Q3’s pace will continue, but a slowdown doesn’t necessarily mean weakness. Though they are barely keeping pace with inflation, wages are rising and firms continue to hire.

Rising wages and job growth support spending. Moreover, most analysts believe that some of the cash payments made to most folks during the pandemic remains in savings.

Geopolitical tremors

The world is a dangerous place. On October 7, Hamas, a designated terrorist group by the U.S. and European Union, launched an appalling and completely unwarranted attack on Israeli citizens and the nation of Israel.

Investors, however, focus on one thing. We recognize it may sound a little callous (and that is clearly not our intent, but we want to maintain a narrow focus and stick to what we know best), but the market attempts to put a price on any geopolitical event, i.e., its economic impact.

Thus far, outside of a brief rise in oil prices, there has been no discernible effect on the broader stock market. In fact, oil prices were down sharply in October—see table of market returns.

Why? For now, investors believe that the violence will be contained, which would limit the impact on the U.S. economy and oil.

Perhaps that is because past geopolitical shocks haven’t had much of a long-term impact.

While what happens in the past is no guarantee of future performance, reviewing 23 separate geopolitical events since Pearl Harbor, the average loss for the S&P 500 on the first day was 1.1%, with an average total pullback of 4.7% (simple return, excluding dividends reinvested), according to LPL Research.

The 1973 Yom Kippur War led to the OPEC oil embargo, soaring oil prices, and a steep U.S. recession, but it was an outlier. Today’s oil market is different, geopolitical dynamics in the Middle East are different, and the U.S. is a leading oil producer.

That said, any significant disruption in oil supplies would send the price of crude higher. Such an event can’t be completely discounted.

Final thoughts

Investors believe the war in the Middle East will remain contained to Israel and Hamas, having little impact on oil prices and the U.S. economy. So far, that has been the case.

Throughout the year, investors have closely monitored the economy and interest rates, as is typical. That’s not likely to change.

Typically, quarterly debt announcements from the Treasury go pretty much unnoticed, but not today.

The Treasury Department announced on October 30 that it will auction $776 billion in debt in the final three months of the year and expects to borrow another $816 billion in Q1 2024.

Much is simply rolling over of maturing bonds. But it highlights the enormous appetite for debt as the Treasury funds the growing federal deficit.

It is also putting upward pressure on bond yields. but it’s difficult to quantify the extent. Amid a moderation in the rate of inflation, rising bond yields are taking some of the pressure off the Fed to raise interest rates, but “higher for longer” is the current mindset among Fed officials.

7300 Wealth Connect – October 2023

Late Summer Doldrums

Stocks have had a strong run this year. A much slower pace of rate hikes, as illustrated in Table 1, a belief (or hope) that the Federal Reserve would stop hiking interest rates and eventually start cutting them, and the absence of a much-forecasted recession.

The rally that began last October for the S&P 500 continued into the third quarter, with the S&P 500 Index peaking at the end of July. It has since fallen a modest 6.6% through the end of September, according to S&P 500 data provided by the St. Louis Federal Reserve.

As discussed last month, August and September have historically underperformed—see Figure 1. The prior two months did not merit exceptions.

While July closed on a high note, the losses incurred in August and September wiped out the early gains made in Q3.

Investors are attempting to price in what analysts call “higher for longer.” Higher refers to interest rates. Longer refers to how long rates might stay higher before any possible rate cut or cuts.

All else equal, higher interest rates create stiffer headwinds for equities because higher rates compete for investor dollars.

Notably, Treasury yields have turned higher, as Figure 2 illustrates.

Throughout the remainder of the year, the Treasury will be required to borrow a significant amount of money. As a result of an increase in the supply of bonds, yields may rise to attract buyers of the new bonds that will be issued.

Moreover, the Federal Reserve surprised many by adopting a more aggressive tone than anticipated at its September meeting.

It’s hard to forecast the future

The Federal Reserve releases its forecasts for GDP, inflation, and unemployment every quarter: December, March, June, and September.

The Fed maintained the fed funds rate at 5.25 – 5.50% in September, but it hinted at another rate hike this year and raised its year-end 2024 estimate of the fed funds rate from 4.6% to 5.1% (Figure 3).

Note that the Fed’s projections in Figure 3 have almost tripled over the last two years as it hopes to rein in stubbornly high inflation. In fact, it has raised its forecast every quarter since September 2021, when it first issued a forecast for year-end 2024.

Two years ago, the Fed expected a 2024 year-end fed funds rate of about 1.8%. At the time, it was calling the burst in inflation “transitory.” Today, its forecast for December 2024 is 5.1%.

The best and brightest minds struggle with accurately forecasting future events because projections rely on developing patterns based on historical data. But patterns may change over time, reducing the effectiveness of these models.

In addition, the influence of different variables on the economy can fluctuate from one economic cycle to another, as each cycle has its own unique characteristics.

For example, rising interest rates raise borrowing costs and should slow consumer and business spending. But economic growth has been surprisingly resilient. As Fed officials are fond of saying, there are “long and variable lags” regarding the impact from changing interest rates.

Final thoughts

As we have emphasized in the past, focus on what you can control. You can’t control the economy or stock market returns, but you can control your investment strategy.

Having a written financial plan is the roadmap to your financial goals. It allows you to track your progress, and it reduces uncertainty. Research shows that a solid plan also supports sound money habits.

7300 Wealth Connect – September 2023

Dog Days of Summer

October has traditionally had a ghoulish reputation for investors. The stock market crash of 1929 and 1987 happened in October. While not a one- or two-day event, the S&P 500 Index shed nearly 17% during 2008, per S&P 500 data from the St. Louis Federal Reserve.

But reputations don’t always square with reality.

Monthly average returns for the S&P 500 Index are reflected in Figure 1. The blue category represents average monthly changes from 1970 to the present, while the red category reflects data from 2010 to the present (through August 2023).

October has historically been a positive month for the market. Since 2010, the S&P 500 Index has been the second-best performing month.

August and September, however, have historically been lackluster months. On average, September has historically been the worst-performing month, with August not far behind.

Over a short period of time, we might expect wide monthly variations. Over a longer period, however, we’d expect those variations to narrow considerably. That’s not been the case.

We get that certain industries experience seasonal fluctuations. For instance, retailers experience increased business during the holiday season. Similarly, ski resorts and outdoor water parks depend on winter and summer for their revenues.

However, experts have struggled to explain monthly stock market variations, including relative weakness in August and September.

Keeping with the historical pattern, the upbeat market performance this year was interrupted in August, with the S&P 500 Index losing 1.77%.


While it is difficult to pinpoint the reason behind long-term sluggishness in August and September, we can provide a more specific explanation for last month’s underperformance. The S&P 500 is well off last year’s bottom. When stocks rally sharply and are seemingly priced for perfection, any uncertainty may create a good excuse for short-term traders to book profits.

For starters, China, the world’s second-largest economy, was supposed to rebound this year following draconian lockdowns last year. Instead, it has been struggling to gain momentum.

Most people won’t be directly affected by what happens in China, but the weakness in the country’s economy can trickle into stocks since many major corporations rely on the country as a source of revenue.

Next, the Federal Reserve’s bark last year was as vicious as its bite. While the Fed continues its verbal assault against inflation, the pace of rate hikes in 2023 has slowed significantly.

However, the U.S. Treasury is ramping up debt issuance, and a strong Q3 start for the U.S. economy helped push the 10-year yield to its highest level since late 2007, according to U.S. Treasury data.

All else equal, higher bond yields create more competition for stocks.

Finally, as we’ve discussed, headwinds came at a time when seasonality sometimes pressures equities. Since 2010, on average, August is the worst-performing month (Figure 1). Since 1970, average performance ranks second from the bottom (Figure 1).

Final thoughts

Since 1970, September has been the only month with a negative average return. However, this does not guarantee that the month that marks the beginning of fall will finish lower.

Since 2010, the S&P 500 has finished higher six times in September, including an 8.8% rise in 2010. August has also advanced six times.

While exercises that pinpoint general seasonal patterns make for an interesting discussion (and help explain last month’s lackluster market return), we know that market timing and implementing strategies based on timing aren’t a realistic approach.

So, control what you can control. You cannot control returns. What you can control is behavior, time in the market, and the amount of risk you take. These variables help us develop a holistic approach to your financial plan.

It’s one more reminder that successful long-term investors recognize that a disciplined approach has historically been the shortest path to reaching one’s financial objectives.

7300 Wealth Connect – August 2023

Market Melt Up

The S&P 500 Index is up 28.3% from its October 2022 low and is 4.3% below its early 2022 alltime closing high, according to S&P 500 data from the St. Louis Fed—data through July 31.

Through May of this year, the S&P 500’s advance was powered by what might be called the ‘magnificent seven:’ Amazon, (AMZN), Tesla (TSLA), Apple (AAPL), Nvidia (NVDA), Microsoft (MSFT), Alphabet (GOOGL, formerly Google), and Meta Platforms (META, formerly Facebook).

According to Investopedia, these seven stocks accounted for 26% of the S&P 500 as of July 6.

However, starting in June, sentiment shifted, and the rally broadened considerably.

If we could construct an equal-weighted gauge of all the S&P 500 stocks, i.e., no stock would carry more weight than any other, that gauge of the stock market would have bested the S&P 500 over the last two months leading up to July 31, according to Yahoo Finance.

The ‘magnificent 7’ would make up just 1.4% of the S&P 500 in our equal-weighted gauge.

Tailwinds that aided shares

For starters, the heavily forecasted recession has been a no-show so far. In fact, according to the latest data from the U.S. Bureau of Economic Analysis, economic growth accelerated in the second quarter.

Gross Domestic Product (GDP), which is the broadest measure of economic activity, increased at an annual pace of 2.4% in the second quarter, up from 2.0% in Q1 (Figure 1).

And we can’t cite one-off factors that sometimes distort the headline number. While consumer spending eased in the second quarter, business spending more than picked up any slack. Overall, it was a very balanced number.

Why does economic growth support stocks? There isn’t a direct one-to-one correlation between GDP growth and equities. But GDP growth supports corporate profits. Longer-term profit growth is an important factor in stock market performance.

According to Refintiv, Q2 profit reports are exceeding a low hurdle, and while the season isn’t complete, the upbeat start has aided shares.

Finally, no update on market performance would be complete without a review of interest rates.

While 2022’s steep rise in interest rates was engineered by the Federal Reserve to address the sharp rise in inflation, it also led to last year’s bear market.

Today, inflation is moderating, and central bankers no longer feel the need to be as forceful.

Figure 2 illustrates the pace of rate hikes since March 2022. Note that the seventh meeting in the cycle (December 2022) was the last increase greater than 25 basis points (bp, 1 bp = 0.01%).

At the end of July, the Federal Reserve increased the fed funds rate by 25 bp to 5.25-5.50%, the highest level in 22 years (meeting 12 in Figure 2). Fed Chief Jerome Powell left the door open to at least one more rate increase. He refrained from any talk about a rate cut this year.

While the fed funds rate is up since the start of the year, the more muted pace, coupled with an expanding economy and a moderation in inflation, have been tailwinds for stocks.

Compare and contrast to this time a year ago when interest rates were soaring, inflation was showing no signs of slowing, and recession worries were on the rise.

Naturally, every trend carries some degree of risk. Geopolitical threats are always present, economic growth may stall, or the current decline in the rate of inflation could be short-lived.

Final thoughts

How did you react to last year’s selloff? Some folks took it in stride, recognizing that stocks rise longer term, but shorter-term setbacks are inevitable.

Others may have found it unsettling, as the appetite for taking on added risk is tested during market declines. If so, it might be time to revisit your strategy.

No matter how you are positioned, successful long-term investors recognize that a disciplined approach has historically been the shortest path to reaching one’s financial objectives.

7300 Wealth Connect – July 2023

Stumbling Into a New Bull Market

Since the beginning of the year, the economy has displayed remarkable resilience in the face of rising interest rates, stubbornly high inflation, and turmoil in the banking sector.

We may be starting to see some cracks develop in the labor market, as layoffs are ticking higher.

But consumers are benefiting from lower gasoline prices compared to a year ago, and consumer confidence just hit its highest reading since the beginning of 2022, according to the Conference Board. Meanwhile, housing prices are inching higher again.

What about those never-ending recession forecasts? Most consumers and businesses haven’t gotten the memo, at least not yet.

As we’ve so often reminded you, economic forecasting is dicey at best, and it’s becoming even more problematic in the post-pandemic world.

This tongue-in-cheek comment included in June’s manufacturing survey from the Dallas Federal Reserve sums things up well.

“We continue to struggle to find qualified staff. We intend to hire more people … so that we have capacity available as soon as the economy starts to recover after the recession that everyone is predicting.”

Maybe continued economic growth is simply a delayed response to last year’s sharp rise in interest rates. Or, if we take the opposing side of the recession argument, today’s 5% fed funds rate isn’t unusually high compared to historical standards, as illustrated in Figure 1.

This is especially true compared to today’s inflation rate of roughly 4-5%.

An important argument against an impending recession has been robust payroll growth.

Any standard definition of a recession would include job losses.

A recent Wall Street Journal article pointed out that a few economists believe the government’s survey is overstating payroll growth. But let’s assume it accurately reflects today’s labor market.

Why has payroll growth been so resilient? In part, it’s an expanding economy. But monthly numbers have averaged over 300,000 per month this year. That has surprised nearly everyone.

Another contributing factor is the abundance of job vacancies, making it easier in some industries to find work.

And some firms are hesitant to lay off employees when challenges surface amid the difficulty in finding qualified workers. Instead, they may opt to reduce work hours as a way to cut costs.

2022’s rally

The rise in the market was initially concentrated in tech stocks, but we saw a broadening of the rally in June.

Through June 30, it’s worth noting that the S&P 500 is up 24.4% from its low in October 2022, signifying the start of a new bull market (St. Louis Federal Reserve data). From a technical standpoint, a 20% rise from the most recent low marks the beginning of a bull market.

Another 7.8% rise in the index would vault it ahead of its record close in early 2022. It would be premature to wave the all-clear sign, as late 2001 and late 2008 experienced brief bull market rallies that faded, but this year’s gains are cautiously encouraging.

Although there is much uncertainty in both the U.S. and global economy, investors have not observed any concrete indications of an impending recession. Plus, the Federal Reserve has slowed the pace of rate hikes this year.

Both factors have been supportive of stocks.

A brave new world

One challenge for economists has been the ability to accurately predict shifts in unemployment and inflation. It has plagued economists for decades. Today, the situation gets more complex.

Currently, analysts are utilizing economic models that do not appear to fully consider all the economic distortions created by the shutdown and reopening of the economy, and an unprecedented injection of $5 trillion in fiscal stimulus.

It has disrupted conventional forecasting models. The combination of fiscal stimulus and the Fed’s strong response laid the foundation for a strong economic rebound. However, they also contributed to inflation, which was compounded by supply chain issues.

It’s a new challenge for the Fed, economists, and investors, especially short-term traders who bet on daily, weekly, or monthly market moves.

Timing has never been a surefire strategy. No one rings a bell at a market peak, and no one rings a bell when a bear market ends.

Market timers occasionally get lucky, but to be successful, one must consistently foresee highs and lows.

As 2022’s bear market came as a surprise to most, many timers failed to anticipate the turnaround this year against the backdrop of a hefty dose of negative sentiment.

That said, successful long-term investors recognize that a disciplined approach has historically been the shortest path to reaching one’s financial objectives.

7300 Wealth Connect – June 2023

Peeking Under the Hood of the Market’s Advance

Market headlines are encouraging, at least on the surface. The tech-heavy Nasdaq Composite is having a stellar year and is up almost 24%. The S&P 500 Index is near its 2023 high and has gained almost 9% through the end of May.

The year 2022 presented significant challenges for technology stocks due to the sharp rise in interest rates last year. This is because fast-growing companies, like those in the tech industry, are typically more vulnerable to downturns when rates rise.

The gentler pace of rate hikes this year has aided the rebound in the Nasdaq. Additionally, the growing interest in artificial intelligence (AI) has also contributed to the success of some of these shares.

But a closer look reveals a less sanguine outlook. Note that the Dow, which is made up of 30 large firms, has lagged badly and is down slightly for the year.

The S&P 500 is a capitalization- (total number of shares multiplied by the stock price) weighted index, giving more weight to larger companies than smaller ones. Accordingly, outperformance among key larger firms is helping fuel gains in the overall index.

Near the end of May, Barron’s highlighted that the upbeat performance of the S&P 500 can be primarily attributed to the dominance of a few major tech stocks.

Upon further examination, it was discovered that only 26% of the S&P 500 firms had outperformed the index in the current year. It is the fewest number since March 2020, according to FactSet.

A cap on government debt

Last month, investors closely monitored discussions regarding the debt ceiling. A compromise was reached between the White House and House negotiators in late May. It sailed through the House on May 31 and moves to the Senate in front of a June 5 deadline, the earliest the debt ceiling might be breached.

If the U.S. were to default, it could lead to various negative outcomes, including unpaid bills, a potential credit downgrade, and severe consequences in both U.S. and global financial markets.

Such consequences could bring about economic instability, higher borrowing costs for the U.S. Treasury, a weaker dollar, and a possible loss of confidence in the U.S. government’s ability to manage its finances.

Please keep in mind that a default has never happened before, and the chances of it happening this time are slim. But if it were to occur, the variables are numerous, and the potential repercussions for the economy and financial markets could be severe.

General themes—interest rates, inflation, the Fed, the economy

It’s not all gloomy. While the rally has been uneven, it has been encouraging to see the S&P 500 Index rally off last year’s low in response to a more measured approach by the Federal Reserve.

The Fed hasn’t let up on its anti-inflation rhetoric, but recent comments from Fed officials, including Fed Chief Jay Powell, suggest the Fed could forgo a rate hike at the mid-June meeting. Ultimately, it may depend on the May CPI and May jobs report.

But is high inflation behind us? The short answer is ‘not yet.’ The core Consumer Price Index excludes two volatile categories: food and energy. Energy is down compared to one year ago. That’s good news, but it has masked a still stubbornly high rate of inflation.

As illustrated in Figure 1, inflation has decelerated from last year but has remained steady at around 0.4% over the past five months—stalled progress.

If annualized, that’s more than twice the Fed’s annual goal of 2%. The slowdown in inflation is uneven, just like everything else. Prices are always stickier going down than going up.

At present, the Fed is striving to maintain a delicate balance by curbing inflation while avoiding a severe economic downturn. The instability witnessed in a handful of regional banks has also contributed to its cautious approach.

A steep recession would probably seal the deal for the Fed on inflation, but the cost would be quite high, including a sharp rise in unemployment.

How does this play out for investors? For much of the year, investors have been weighing any favorable tailwinds from an eventual end to the rate-hike cycle with worries that the cumulative impact of rate hikes could lead to a recession later in the year.

As May concludes, the economy is experiencing growth, the unemployment rate is low, the economy is adding jobs (Figure 2), and market trends suggest investors aren’t expecting a recession this year.

Why? The outlook is murky at best, but there aren’t yet any concrete signs that an economic contraction is imminent.

7300 Wealth Connect – May 2023

March’s Lion Gives Way to April’s Lamb

Attention last month shifted away from March’s banking crisis, as investors turned their focus back toward the Federal Reserve and the economy.

First Republic Bank (FRC) was still on shaky ground, reporting it lost a significant percentage of its deposits during the first quarter, according to its Q’1 press release.

On May 1(Today), JPMorgan Chase (JPM) announced it will acquire all of FRC’s deposits and a substantial majority of its assets.

Coupled with measures taken by the Fed and other government agencies in March, investor anxieties seem to have calmed down a bit.

This isn’t 2008 when lenders were too willing to make home loans to just about anybody who wanted one. Today, the regional banks that failed held high-quality assets but made a bad bet on interest rates.

With a relative degree of stability in the banking system, the Fed, which hiked the fed funds rate by 25 basis points (bp, 1 bp = 0.01%) in March, appears set to hike at its early May meeting by another 25 bp to a range of 5.00—5.25% (Figure 1).

Despite the Fed’s aggressive path, even at 5.125%, the fed funds rate adjusted for inflation is near or slightly below zero, depending on how one measures inflation (Figure 2). During ‘more normal’ times, that would encourage economic growth.

Think about it. Why not take out a loan that can be paid back in cheaper dollars? But it would be difficult to contend that today’s economy is ‘normal.’ The Conference Board’s Leading Economic Index has fallen for 12 straight months.

The rate of contraction accelerated in the last six months, according to the Conference Board, suggesting that a recession this year seems likely.

Moreover, the Fed’s Beige Book, which is a compilation of anecdotal evidence from around the nation, noted that bank lending standards, which were already getting tougher over the last year, tightened further following Silicon Valley Bank’s failure.

Why does this matter? Increased difficulty in obtaining loans can throttle consumer and business spending.

It’s one reason why investors currently believe that May might be the Fed’s last rate increase.

Or, at a minimum, it may pause and survey the economic landscape before making any other decisions.

It would be a shift for the Fed, which was quite resolute last year in its determination to get inflation back to its 2% annual goal. Fed Chief Powell had said he wanted “clear evidence that inflation is moving back down to 2 percent” before ending rate hikes.

Inflation has moderated, but it’s difficult to assert that inflation is returning to 2% right now. A big slowdown in the CPI is simply the result of falling oil prices—see Figure 2. As many are aware, oil can give, but it can also take away.

Has the Fed moved the goalpost? We may get a clearer picture following the early May meeting.

Job growth

It’s not all doom and gloom. Stocks have rallied since the start of the year, and bond yields are off their highs.

Gross Domestic Product (GDP), which is the largest measure of the value of goods and services, expanded at a 1.1% annual pace in the first quarter, per the U.S. Bureau of Economic Analysis (BEA). It missed expectations but remained positive.

Furthermore, the economy continues to create jobs, despite high-profile layoffs. Job growth has been stable and strong for over a year—see Figure 3.

When it landed outside of the range, it surprised to the upside.

Some of the gains, maybe much of the rise in recent months, may simply be due to the still high level of job openings in some industries, especially in lower-paying service jobs.

Some of the cash from the Covid-related stimulus remains in the bank, which may help support spending in the coming months. Plus, government purchases have grown rapidly in recent quarters, according to the U.S. BEA.

It helps the economy in the short term, as it supports demand for goods and services. But the flip side is an increase in the deficit and added pressure on inflation.

As April ended, investors grappled with conflicting crosscurrents.

On the one hand, rate hikes may soon end. Ultimately, it will depend on inflation and economic growth. On the other hand, a recession would probably increase headwinds for investors.

Major market indexes rose during April, signaling that most investors remain in the no-recession camp.

A so-called ‘no-landing’ scenario (continued economic growth, high inflation) would keep upward pressure on rates.

A ‘soft landing’ (slowing growth, slowing inflation)’ is the best-case scenario. Rate hikes would probably end, and we might even see a cut in rates, and a recession is avoided.

A ‘hard landing (recession, slower inflation)’ can’t be ruled out. It would likely lead to rate cuts, but the cost would be rising unemployment and weak corporate profits.

7300 Wealth Connect – April 2023

Financial Earthquake

What causes a bank to fail? The short answer is a loan portfolio stuffed with bad loans. In most cases, banking regulators close banks they view as insolvent before a bank run.

But that was prior to Silicon Valley Bank’s (SVB) failure. What happened?

SVB focused on wealthy venture capital clients. As funding for ventures began to dry up, bank customers drew down their balances.

SVB wasn’t saddled with bad loans. Instead, its portfolio of assets was concentrated in supersafe, longer-term Treasury bonds. So far so good, until the surge in interest rates pushed bond prices lower. Bond yields and bond prices move in the opposite direction.

The bank wasn’t subject to much credit risk. Instead, it was exposed to interest rate risk. It’s not fatal, as long as the bank holds the bonds to maturity. But with deposits being drawn down by its customer base, SVB revealed late Wednesday, March 8, that it had sold $21 billion in bonds to free up cash, taking an after-tax loss of $1.8 billion.

It also announced a plan to raise capital and shore up its balance sheet. But the next day, the stock tanked, plans to raise capital were scuttled, and deposits that were above the FDICinsured limit began to flee the bank.

Welcome to the digital age

Depositors weren’t lined up at SVB branches. It was a bank run via smartphones, which was exacerbated by customers that announced intentions via social media. The panic that ensued forced regulators to close the bank Friday morning, March 10.

In less than 48 hours, a bank that had a concentrated position in super-safe Treasury bonds was no longer.

One more failure

Signature Bank, which was heavy in the cryptocurrency space, was closed on Sunday. Without buyers for both banks, the FDIC made a ‘systemic exception,’ guaranteeing all bank deposits at the two banks.

A systemic event is typically defined as an event that risks serious consequences to the financial system and spills over to the rest of the economy. Lehman’s failure in 2008 was a systemic event, as it sparked the financial crisis.

As controversial as it was, Treasury and Federal Reserve officials feared massive bank runs could take place Monday morning, as worried depositors might flee to the “too-big-to-fail” banks or into Treasury notes and bonds.

In addition to full FDIC coverage, the Fed announced a new program that will allow banks to borrow at the maturity (par) value of high-quality bonds.

That way, if the need arises, banks would no longer be forced to sell their bonds at a loss. Swift action to ring-fence the failed banks has not fully restored confidence in the financial system, but it has calmed frayed nerves, and there has been no contagion so far.

Customer cash accounts above the FDIC limit of $250,000 aren’t new. But following the events of recent days, it has created new anxieties, even if they turn out to be temporary.

Fallout

Today’s problems are not comparable to 2008 when poorly underwritten home loans threatened to blow up the financial system.

SVB’s failure was tied to high-quality Treasury bonds that fell in value because of rising interest rates. Regulators will pour over the details, but the finger-pointing has already begun.

Meanwhile, the Federal Reserve was probably on track to lift the fed funds rate by a half percentage point to 5.00 – 5.25% at its late-March meeting. That was before the crisis.

They opted for a quarter percent. The message: we still want to fight inflation (or at least give that appearance), but we are focused on the banks and financial stability.

Currently, the Fed is trying to thread a very tiny needle, focusing on two conflicting goals: raise rates to fight inflation, which could add unwanted stress on banks. Or, abandon its inflation fight (at least for now), and shore up the financial system.

The crisis might do the Fed’s job for it. You see, lending standards were already tightening. The events of recent days could cause additional hurdles for consumers and businesses looking for loans, which would slow the economy down and aid in the fight against inflation.

How much of a slowdown or is a recession inevitable? No one knows.

In recent days, sentiment has shifted on rates, but sentiment on rates is ever-changing, as we’ve seen this year. How the Fed responds in the coming months will depend on how the economic outlook unfolds.

In a nutshell, inflation hasn’t been squashed, but problems with SVB have not spread to other banks. The crisis has waned. We aren’t seeing contagion among weaker banks, which helped stocks rally in recent days, and the first quarter ended on a favorable note

7300 Wealth Connect – March 2023

Investors Fret Over Faster Economic Growth

The year started on a positive note as investors attempted to price in a sharp slowdown in rate hikes and a near-term peak in the fed funds rate. While a peak in rates this month was probably too optimistic, the Fed followed the rate-hike script, boosting the fed funds rate in early February by 25 basis points (bp, 1 bp = 0.01%) to 4.50—4.75%.

But economic activity diverged from the script.

Shortly after the Fed’s rate increase, the U.S. BLS reported that January nonfarm payrolls exploded, rising over 500,000.

In part, there are so many job openings to fill. Despite high-profile announcements among some firms, layoffs remain low, and some of the job creation is simply the byproduct of economic growth.

In addition, consumer spending, which accounts for about 70% of economic activity, surged in January, easily offsetting weakness in November and December (U.S. BEA data).

While inflation slowed late last year, revisions to the data reveal it didn’t soften as much as initially reported. Moreover, January’s inflation data came in hotter than expected.

The road to price stability wasn’t going to be a straight line, but upward revisions were a disappointment.

What does this all mean? Sentiment on the rate front quickly shifted last month, and investors now believe a more aggressive response by the Fed could be forthcoming.

It’s not market-friendly, as February gave back some of January’s advance.

No landing

Soft or hard landing scenarios have dominated financial market headlines. The narrow path to a soft economic landing simply means an economic slowdown that brings about a much slower rate of inflation without a recession. It’s the best path for investors.

According to the Fed’s rationale, much slower economic growth allows the supply of goods, services, and labor to match demand, which reduces pricing power and inflation.

As the term implies, a hard economic landing would be defined as a recession that significantly raises the unemployment rate. Inflation would likely slow, but the cost would be high.

While January’s data is just that, a one-month data point, economic vigor encouraged analysts to coin a new term: ‘no landing.’ In other words, the economy continues to expand through 2023, and inflation doesn’t slow much from its current pace.

What is the thinking behind no landing? Well, cost-of-living pay increases and a just-enacted rise in Social Security payments are boosting income and spending.

In addition, plenty of stimulus cash from generous cash payments during the pandemic still resides in savings. Such savings can still fuel spending, too.

While spending on goods has gradually slowed, spending on services, which is the largest sector of the economy, is trending higher. It’s a shift away from spending on “stuff” to spending on entertainment, travel, and experiences.

Despite sharp rate increases, interest rates adjusted for inflation are still negative across the yield curve.

Figure 2 plots Treasury yields by maturity (1 month to 30 years) and subtracts the January rate of 5.6% for the core Consumer Price Index (CPI less food and energy). If the headline CPI was used, the yield would be almost one-percentage point lower.

This is important because low yields and lower interest rates relative to inflation may encourage borrowing and spending because the interest rate adjusted for inflation is nominal or negative.

Note in the table of stock and bond returns that bond yields rose last month in response to recently revised rate-hike expectations. Higher rates compete for investor dollars, which can create added headwinds for stocks.

Sentiment can change quickly, as we saw last month. Perhaps we will be having a different conversation later in the year, as economic growth is typically uneven.

For now, last month’s economic acceleration was viewed negatively by investors, who have grown weary of high inflation and upward pressure on interest rates.

7300 Wealth Connect – February 2023

Seven Changes in Retirement Laws That May Affect You

Over three-quarters of Americans are anxious about their financial future, according to a Mind over Money survey by Capitol One and The Decision Lab.

Notably, 68% of survey respondents are worried about not having enough for retirement. Of course, it doesn’t have to be that way if we meet the problem head-on and hammer out a plan that helps you secure a comfortable retirement.

At the end of last year, Congress passed The SECURE Act 2.0, a follow-up to an overhaul of retirement laws passed just three years ago.

The changes build on SECURE 1.0, make it easier to save for retirement, and may help stretch out your savings while in retirement.

Let’s look at some major provisions that will help workers, followed by changes that may assist those who have left the workforce.

  1. Starting in 2025, companies that set up new 401(k) or 403(b) plans will be required to automatically enroll employees at a rate between 3—10% of their salary.
    Employees may choose to opt out, but we believe that saving for retirement is nonnegotiable. The new law also makes it easier to transfer low-balance plans to new ones.
  2. If you are enrolled in a Roth 401(k), you won’t be required to take what’s called a Required Minimum Distribution (RMD) from your Roth 401(k). That begins in 2024.
  3. Starting next year, employers will be allowed to match student loan payments made by their employees. The employer’s match must be placed in a retirement account.
    This doesn’t benefit everyone, and we understand the controversy that surrounds student loan debt forgiveness. But if your employer offers this benefit, it’s a great way to capture free money for retirement.
  4. In 2025, 2.0 increases the catchup IRA provision for those between 60 and 63, from $6,500 in 2022 ($7,500 in 2023 if 50 or older) to $10,000. The amount is indexed to inflation. Catchup dollars are required to be made into a Roth IRA unless wages are under $145,000.
  5. Starting in 2024 and subject to annual Roth contribution limits, assets in a 529 college savings plan may be rolled into a Roth IRA, with a maximum lifetime limit of $35,000. The 529 plan must be at least 15 years old and in the beneficiary’s name.

What if you are already retired?

  • A key provision raises the age for an RMD to 73 years old from 72, starting in 2023. The age rises to 75 in 2033.

    If you turned 72 in 2022, you’ll stick with the previous timetable. If you turn 72 this year, you may delay your RMD until 2024, when you turn 73. Starting in 2033, the age for an RMD rises to 75. Generally, the longer you can shelter assets from taxes, the better.

  • Additionally, the penalty for failing to take your RMD from a retirement account that requires such a distribution drops to 25% from 50%.

    If the missed RMD is taken in a timely manner and an updated tax return is filed, the penalty is reduced to 10%.

This is not all-inclusive. There are provisions that allow for hardship withdrawals, charitable contributions, withdrawals tied to domestic violence, and federally declared natural disasters. We encourage you to check in with your tax advisor if you have any tax-related questions.

We are also happy to entertain any questions you may have, including planning questions that will help you take advantage of the new law.
Sources: Fidelity, Charles Schwab, Think Advisor, Wall Street Journal

Running through the numbers—cautious optimism as the year begins

When January is positive, the S&P 500 Index has gone on to end the year higher 75% of the time, according to Fidelity (since 1945). The S&P 500 advanced 6.18% in January—see table of returns below.

Perhaps the proclivity of the market to move higher plays a big role. Besides, simply starting out well in January gives one a head start on the rest of the year.

From 1970 through 2021, the S&P 500 Index exceeded a 5% gain in January 10 times (St. Louis Federal Reserve data). Excluding reinvested dividends, it went on to finish the year higher 9 times.

During the 10 years when January advanced by 5% or more, the S&P 500 averaged a return of 21.5%. Its best annual return was 31.6% in 1975, after exiting the difficult 1973-74 bear market. Its weakest return was a decline of 6.2% in 2018.

Such exercises are interesting, but every cycle has its own peculiarities. We know that past performance does not guarantee future results. Ultimately, the economic fundamentals will play a big role as the year unfolds.

While there has been no shortage of recession talk, market performance in January suggested that investors don’t believe a recession will materialize in the early part of the year.

In addition, heavy bearish sentiment sometimes sets the stage for a market bounce, as we saw at the beginning of the year.

More importantly, the Federal Reserve is signaling a slowdown in the pace of rate hikes, which aided January’s advance. Investors also expect at least one rate cut this year. That may have added to gains, but it is something the Fed has pushed back on.

A quick note of caution is in order. Fed rate forecasts in early 2022 were way off the mark.

However, it would be favorable if the economy avoids a recession, the rate of inflation continues to slow, and the Fed stops raising interest rates.

7300 Wealth Connect – January 2023

2022 – Shifting Forces

The market had a banner year in 2021, with the S&P 500 Index advancing over 25%, according to data from the St. Louis Federal Reserve. But tailwinds that fueled gains shifted dramatically in 2022. No longer were the economic fundamentals favorable.


With inflation proving to be much more stubborn than expected, policymakers at the Federal Reserve hiked interest rates at the fastest pace in over 40 years, surprising investors and sending stocks into a bear market.

Higher interest rates pressure equities for two primary reasons. First, higher rates compete for investors’ cash. Second, higher rates eventually slow economic growth, which pressures corporate profits.

Rate-hike cycles are not created equally. In the past, rate increases began prior to a level considered full employment, proactively striking out against inflation.

Last year, however, the Fed’s posture was reactive, raising rates after the inflation genie had popped out of the bottle.

Figure 1 illustrates the first-rate hike cycle following a recession, dating back to the 1981-82 recession.

The current cycle is by far the most aggressive—4.25 percentage points in just 10 months. Today’s cycle has only been topped once. In the second half of 1980, the Fed raised the fed funds rate by a whopping 10 percentage points in just six months.

Table 2 illustrates the return of the S&P 500 Index (without dividends reinvested) from the first rate increase to the final increase in each series of increases.

The two most aggressive cycles—1994 and 2022—created the stiffest headwinds for investors. Stocks performed best during the very gradual moves during 2015—2018.

In fact, the S&P 500 Index was up over 40% between December 2015 and September 2018 before shedding about half its gain during the final three months, as recession concerns surfaced.

Looking ahead, the Fed expects to slow the pace of rate hikes this year but has also signaled that it could maintain a peak rate over a longer period, as it hopes to wring inflation out of the system.

But be aware that a glance into the future is murky at best. The Fed’s own forecast one year ago envisioned rates hikes totaling just 0.75-percentage points for the entire year. Even the smartest folks in the room aren’t exempt from a bad forecast.

While inflation remains too high, the rate has moderated. After peaking at a 40-year high of 9.1% in June, the Consumer Price Index (CPI) slowed to 7.1% as of November.

The core CPI, which strips out food and energy, hit a peak of 6.6% in September and has eased to 6.0% as of November (U.S. Bureau of Labor Statistics).

But it remains well above the Fed’s annual goal of 2%.

Blame the war in Ukraine, which disrupted traffic in commodities including wheat and oil, for the much bigger jump in the headline CPI.

Lessons from the past

Whether we agree or disagree that the Fed’s tough posture is the right medicine, its decisions are rooted in the lessons of the 1970s.

In the mid-1970s, the Fed sidelined its fight against inflation while prices were still rising between 6% and 7% per year. Inflation roared higher in the late 1970s and peaked at nearly 14% in 1980. Inflation was fully embedded in the economy, which required a massive response.

Inflation turned lower, but the cost was a steep recession in 1981-82. By acting forcefully now, the Fed hopes to avoid a repeat. However, do not expect prices to return to pre-pandemic levels.

A look ahead—hard landing or soft landing

The Fed’s actions have raised fears that the economy is on a collision course with a recession—a hard landing.

“Usually, recessions sneak up on us. CEOs never talk about recessions,” said economist Mark Zandi of Moody’s Analytics. “Now it seems CEOs are falling over themselves to say we’re falling into a recession. … Every person on TV says recession. Every economist says recession. I’ve never seen anything like it.”

If we slip into a recession, rate hikes would probably cease, and we might see a series of rate cuts. But corporate profits would turn lower, too.

Yet, a recession is not a foregone conclusion. A resilient labor market and a sturdy consumer, with borrowing power and some pandemic cash still in the bank, could help keep the economy on a gradual but upward path this year.

Long-term optics

As the economy expands over a long period, corporate profits rise as well. A well-diversified portfolio enables an investor to tap into that longer-term growth.

Let’s review Figure 3. The S&P 500 Index has averaged a 12.6% annual return, dividends reinvested, since 1980.

Up years accounted for 81% of the period surveyed. Simply put, on a historical basis, stocks perform well over a longer period, but pullbacks are common, too.

There were 14 instances when the S&P 500 ended a year higher after the broad-based index had an intra-year peak-to-trough selloff of over 10%.

Notably, stocks performed exceedingly well in 1985, 1995, and 2019. These years marked the first year after a Fed rate-hike cycle when the Fed succeeded in engineering a soft landing.

We may not avoid a recession this year, and sentiment heading into 2023 is unsettling. However, if we were to take a contrarian view, any positive surprises could be a catalyst for gains this year.

For example, a sharp slowdown in inflation, without an ensuing recession, would encourage the Fed to adjust policy.

Still, let’s acknowledge that any look ahead is informed by today’s landscape. Peering into the future is an exercise in uncertainty. Surprises, both positive and negative, are to be expected.

Investor’s corner

A financial plan is never set in concrete. It is a work in progress and can and should be adjusted as life unfolds.

When stocks tumble, some investors become very anxious. When stocks are posting strong returns, others feel invincible and are ready to load up on riskier assets.

We caution against making portfolio adjustments that are simply based on market action.

Remember, the financial plan is the roadmap to your financial goals. In part, it is designed to remove the emotional component that may encourage you to buy or sell at inopportune times.

That said, has your tolerance for risk changed considering this year’s volatility? If so, let’s talk.

7300 Wealth Connect – December 2022

Investors Ignore Crypto Flames as Slowing Inflation Fuels Stock Gains

Investopedia defines a Santa Claus rally as a rise in stocks in the week leading up to Christmas Eve. The other scenario suggests that a Santa Claus rally occurs during the week that follows Christmas through January 2.

Whichever way we might define the term, the rally that began in October and led to an 8% rise in the S&P 500 Index and a nearly 14% surge in the Dow Jones Industrial Average (MarketWatch) carried over into November.

It might not fit the traditional definition of a Santa rally, but the holiday season’s ever-growing reach coincided with a November rally that helped the major indexes pare losses that began in January.


Last month’s catalyst was growing evidence that the rate of inflation may finally be starting to slow down.

On November 10, the U.S. Bureau of Labor Statistics (BLS) reported that the Consumer Price Index (CPI) rose 0.4% in October. The core CPI, which strips out food and energy, rose 0.3%. Analysts polled by MarketWatch had forecast 0.7% and 0.5%, respectively.

The date is highlighted because the smaller-than-projected rise in the CPI fueled a 1,270-point rise in the Dow, or 3.7%, that day. The S&P 500 gained 5.5%, and the Nasdaq rose 7.4% (CNBC).

Why the dramatic reaction? A slowdown in the rate of inflation will take some pressure off the Federal Reserve, which has been aggressively hiking rates to tame inflation.

Rate hikes create headwinds for equities for two reasons. First, higher interest rates compete for investor cash. Second, higher rates will eventually slow economic growth, which will probably hamper corporate profits.

One risk going forward is the growing threat the economy might slip into a recession next year.

The real deal or another head fake?

Figure 1 illustrates the trend in the core CPI since 2020.

We’ve witnessed a pullback in inflation this year: one in March and one in July. But there was a lack of follow through. The smaller-than-expected rise in October is welcome, but it is not consistent with the Fed’s annual goal of 2% inflation.

The return to price stability won’t occur overnight. Still, note the dip in October for the 4-month moving average. It is cautiously encouraging.

Yet, we are not out of the inflationary wood. While wholesale prices continue to ease (U.S. BLS data), inflationary-wage gains, which put upward pressure on prices, have yet to subside.

As we head into December, the Fed is suggesting rates could remain elevated for a longer period, but the increases appear set to slow, which has been a favorable development for investors.

Crypto crumbles

The bankruptcy of several cryptocurrency trading platforms, including FTX (the world’s 3rd largest by trading volume per the Wall Street Journal), highlights the highly speculative nature of trading in crypto.

However, “digital bank runs” and the evaporation of liquidity haven’t spilled over into the broader economy and traditional financial markets. It’s in sharp contrast to what happened when Lehman Brothers collapsed in 2008 and quickly roiled interconnected financial markets.

Practically speaking, the crypto space is fenced off from the rest of the economy.

Today, we don’t see traditional firms providing much capital to crypto firms. Therefore, they are not in line with other unsecured creditors, writing off investments, or seeking taxpayer funded bailouts.

Once the crypto dominoes fell, they knocked down dominoes in the crypto world. So far, the damage has been limited mostly to investors in cryptocurrency.

7300 Wealth Connect – November 2022

A Brighter October

The same headwinds that have clouded the economic outlook and the investing landscape remained in place as the calendar shifted from September and moved into October.

But that didn’t prevent the Dow Jones Industrial Average from turning in its best monthly performance since 1976, according to Barron’s.

Notably, market action this year followed a typical seasonal pattern—weakness in September and strength in October, according to S&P 500 data from the St. Louis Federal Reserve.

Three factors did most of the heavy lifting last month:

  • Oversold conditions led to buying—technical factors,
  • Q3 profits are clearing a low hurdle, coming in better than expected (Refinitiv), and
  • A late month story in the Wall Street Journal suggested that some Fed officials are showing greater unease with big rate hikes to fight inflation.

Another jumbo-sized rate hike is expected in November, but some folks at the Fed may want to slow things down and assess the economic impact of prior increases.

Nonetheless, inflation has yet to ease—see Figure 1.

Meanwhile, Gross Domestic Product (GDP), which is the largest measure of goods and services, rebounded in Q3 following declines in Q1 and Q2 (Figure 2).

Rising at a 2.6% annualized pace in Q3, real (inflation-adjusted) GDP hit a record $20.0 billion, barely eking out the prior record in Q4 2021.

Note how nominal (non-inflation adjusted) GDP has surged while real (adjusted for inflation) GDP has been nearly flat over the last four quarters. This means that the volume of goods and services moving through the economy has been almost flat (real GDP), as price hikes drove the total value of output (nominal GDP).

While GDP is an important quarterly report, it is backward-looking. In this case, July through September. We’re in November.

Investors attempt to price in economic events anywhere from six to nine months in the future.

Housing, which is an important leading economic indicator, is in a recession thanks to the stratospheric rise in mortgage rates.

The Leading Index, which consists of 10 economic reports that tend to presage economic activity, has dropped in six of the last seven months, according to the Conference Board.

The Leading Index has a perfect record of calling recessions over the last 60 years, but nailing the onset of a recession is not its strong point

A peek ahead

Historically, the fall typically marks a stronger seasonal period for stocks, according to the Stock Trader’s Almanac. The midterm elections could also bring some much-needed clarity.

Still, the economic fundamentals that have contributed to today’s bear market have yet to unwind.

But, as we’ve said before, no one rings a bell when a bear market ends. Investors seek out trends before they explicitly show up in the economic data. A durable market bottom will likely occur before the current trend shifts.

7300 Wealth Connect – October 2022

Rate-Hike Worries, Economic Uncertainties Cloud Outlook

The table of returns reflects a continued drop in stocks and rise in yields during the third quarter. It does not reflect a bear market rally during July and early August.

The Federal Reserve hiked its key rate, the fed funds rate, by another 75 basis points (basis points = bp; 1 bp = 0.01%) in July to 2.25—2.50%. Some of Fed Chief Jay Powell’s remarks seemed to suggest the Fed might soon slow its pace of rate increases.

Predictably, stocks gained ground. In fact, the S&P 500 Index retraced more than 50% of its prior peak-to-trough decline (Bloomberg News).

But Fed officials pushed back on the idea of a Fed pivot. At the end of August, Powell’s short but direct nine-minute speech at a symposium in Jackson Hole, WY stressed the Fed’s resolve to bring inflation back down, and equities gave up ground.

A disappointing Consumer Price Index released in September and a very hawkish tone from the September 21st Fed meeting, including another 75 bp rate hike, signaled a steely resolve to squash inflation, and market volatility continued into the end of the month.

Take the Fed’s projections in Figure 1 with a couple of grains of salt.

The Fed failed to forecast the initial strength of the economic recovery and bet that last year’s surge in inflation would be transitory. Its forecasting models are not that credible right now.

But the shift in the rate forecast caught the attention of short-term traders. You see, the Fed raised its year-end forecast for the fed funds rate by a whopping 100 bp from June to 4.4% and its year-end 2023 forecast by 80 bp to 4.6%.

That’s a significant change in a mere three months. It signals that November might give us afourth-straight 75 bp rate hike and another 50 bp in December.

Even without those hikes, the Fed’s campaign has been the most aggressive since the second half of 1980, when it lifted the fed funds rate from about 9% to 19% in only six months, according to data from the St. Louis Federal Reserve.

Bottom Line

The speed and tenacity of the Fed’s moves have jarred investors. Higher interest rates compete for investor dollars and hamper economic growth.

The soaring dollar against major currencies, which has occurred amid heightened global uncertainty and higher rates at home (rising interest rates encourage foreign investors to seek higher returns in the U.S.), added to financial instability.

Additionally, the Fed’s campaign is raising fears that it could “break” something in financial markets, whether in the U.S. or abroad.

Although markets typically have an upbeat Q4, according to S&P 500 data from the St. Louis Federal Reserve, inflation has yet to decisively move to the downside and peak hawkishness has been elusive.

Furthermore, an economic downturn is a real possibility next year.

But bear markets end when negativity is high. No one rings a bell when the storm is over. We saw that in 2009, the steep market corrections of 2011 and 2018, and again in 2020.

During the recovery from the 2008-09 financial crisis and the pandemic-led bear market, sentiment remained decidedly negative as stocks initially rallied.

Economic and market forecasting is a very inexact science. Simply put, there are too many unknown variables. But the table below offers a historical perspective.

The peak-to-trough decline for the S&P 500 is 25.2% through September 30.

7300 Wealth Connect – September 2022

Powell’s Volcker Moment

Paul Volcker headed up the Federal Reserve between 1979 and 1987. He is widely credited with squashing the inflation that seeped into nearly every corner of the economy in the 1970s.

But the medicine the Fed force-fed us was harsh. The Fed pushed up its key rate, the fed funds rate, to almost 20% by the end of 1980, per the St. Louis Federal Reserve. The jobless rate rose to nearly 11% in late 1982, which at the time was the highest since the 1930s.

It broke the back of inflation. But the price was steep, as the U.S. fell into a deep recession.

Today, inflation is high, but isn’t as embedded in the economy as it was in the 1970s. So far, the medicine that’s needed is unlikely to be as harsh as during the early Volcker years.

However, like the jump in interest rates that stifled demand for goods, services, and workers, the Fed is hoping to employ lessons learned in the 1970s without a steep recession.

For starters, the Fed quickly jettisoned its zero-rate money policy, it’s no longer talking ‘transitory inflation,’ and it wants to avoid the stop and go attack on the wage/price spiral in the 1970s, which failed to quell inflation and led to a harsh policy response from Volcker’s Fed.

In other words, the longer inflation persists—the thinking goes—the more difficult it is to put the inflation genie back in the bottle.

Before we go on, let’s acknowledge that Powell and the highly credentialed economists at the Fed failed to forecast the persistent rise in inflation and failed to react last year. Today, they are playing catchup.

While it would be unfair to blame today’s inflationary environment completely on the central bank—trillions of dollars in fiscal stimulus, pandemic lockdowns, and supply chain woes have also contributed to the problem, they are tasked with cleaning up the mess.

Powell’s Fed is well aware of the mistakes that helped lead to the prolonged period of rising prices in the 1970s, and central bankers don’t want a repeat.

Yet, over the short term, 2022 has been a period of heightened uncertainty for investors. That said, at the end of August, Powell vigorously reiterated the Fed’s commitment to bringing inflation back down.

In a brief speech that lasted fewer than 9 minutes, Powell called the Fed’s goal of price stability its “overarching focus right now.”

“Restoring price stability will take some time and requires using our tools forcefully to bring demand and supply into better balance,” he said.

Powell added that softer economic growth will “bring some pain to households and businesses. These are the unfortunate costs of reducing inflation. But a failure to restore price stability would mean far greater pain.”

Powell’s use of the word ‘pain’ is unusual for a Fed chief. However, in no uncertain terms, he wanted to communicate that the Fed is resolute in its fight and will do what’s needed to force inflation back to the Fed’s 2% target.

Threshold for pain

How much pain the Fed might inflict on the economy is unknown. Would the Fed blink if anything more than a mild recession took hold? Is there an economic line in the sand?

The Fed’s not saying. If it revealed a line it won’t cross, its credibility would further come into question. Yet, a squash-inflation-at-all-costs mentality could bring a political backlash.

Please review Figure 1. Note that inflation has historically peaked during a recession and eases in the early stages of an economic recovery.

Recessions blunt demand for goods and services, commodities, and labor. Businesses typically struggle to raise prices during a recession, while a rise in unemployment puts a lid on wage hikes and cost pressures. It wrings inflation out of the economy. In the months that follow a recession, excess capacity tends to keep inflation low.

When we have seen inflation slow outside a recession, it occurred amid a sharp but temporary drop in oil prices (mid-1980s and late 1990s), or the sharp productivity gains of the 1990s.

Today, the Fed is turning to what it believes is its tried-and-true anti-inflation playbook.

During the early part of August, investors seemed optimistic the Fed might cut rates next year. A host of Fed speakers and Powell blunted such hopes, sparking a fresh round of volatility.

Bottom line

Powell mentioned pain. Today, the Fed is trying to stifle demand for goods and services and significantly slow wage increases. The high number of job openings leaves it some wiggle room that might help prevent a recession or anything more than a mild recession.

The Fed also wants to bring down commodity prices and lower prices for housing and financial assets. The rate of inflation may have already peaked, but the Fed doesn’t want to declare victory until its convinced price stability is within its grasp.

7300 Wealth Connect – August 2022

Investors Look Beyond Inflation, Rate Hikes, and Recession Fears

Inflation is high, the Federal Reserve is hiking interest rates, Gross Domestic Product (GDP), which is the broadest measure of economic activity, is declining. Yet, the stock market had a significant rebound in July.

Investors attempt to price in events before they hit the headlines. We saw it in the first half of the year. But does July’s rally herald better economic news, or is it simply a bear market rally?

Inflation is a big problem, no question about it. In June, the Consumer Price Index hit 9.1%, according to the U.S. Bureau of Labor Statistics (BLS). It’s the worst reading in over 40 years.

However, gasoline prices fell in July, commodity prices are down, and there are some cautiously encouraging signs that inflation may finally be peaking.

It doesn’t necessarily mean that inflation will slow sharply. But if the worst is behind us (a big maybe), it would be encouraging news for investors.

Meanwhile, the Federal Reserve just hiked the fed funds rate by 75 basis points (bp, 1 bp = 0.01%) to a range of 2.25-2.50%.

Since early May, the Fed has boosted the fed funds rate by 200 bp. It’s the most aggressive series of rate increases since early 1982—see Figure 1.

In the past, the Fed seemed willing to throw a lifeline to investors when market declines turned ugly. Not today. It’s a different environment, as the Fed seems intent on squashing the very inflation it helped create.

Yet, it would be unfair to blame today’s inflationary environment completely on the central bank. Trillions of dollars in fiscal stimulus, pandemic lockdowns, and supply chain woes have also contributed to inflation.

During his July 27 press conference, Fed Chief Jerome Powell forcefully argued the Fed will maintain its course until it sees “compelling evidence that inflation is moving down, consistent with inflation returning to 2%.”

Yet, he hinted that the Fed might slow its pace of rate increases later in the year. Investors took that as an encouraging sign. Still, it’s highly dependent on inflation.

Lastly, GDP is down two-straight quarters: a 1.6% annualized drop in Q1 and a 0.9% annualized decline in Q2, according to the U.S. Bureau of Economic Analysis.

It meets the common and simple definition of a recession. But are we in a recession?

The National Bureau of Economic Research (NBER) makes that determination in the U.S. It can take months for the NBER to declare and backdate the start of a recession.

The NBER defines a recession as “a significant decline in economic activity that is spread across the economy and that lasts more than a few months.”

Well, GDP is down for more than a few months, but to contend that any decline is significant and is spread across the economy is far more problematic.

While business spending fell in Q2 and residential construction got clobbered, consumer spending, which accounts for 70% of GDP, increased, albeit at a slower pace than Q1.

Over the last six months through June, the U.S. BLS said payroll growth has averaged 457,000 per month. Layoffs, not significant job growth, mark recessions.

While GDP may not tell the entire story, economic growth has significantly slowed, wages are not keeping up with inflation, and stocks stumbled in the first half of the year.

Consequently, it’s a gloomy number, even if the economy hasn’t yet met the NBER’s strict definition. Perhaps the term stagflation, stagnate economic growth + inflation, more closely describes today’s environment.

Bottom Line

Investors attempt to price in and anticipate events by roughly six to nine months. In the first half of the year, investors correctly anticipated the uncertain economic environment.

Investors also seem to be pricing in a mild recession.

The Conference Board, which releases the monthly Leading Economic Index (LEI), believes “a recession around the end of this year and early next is now likely” after its Index fell for four consecutive months (through June). The LEI is designed to foreshadow economic trends.

A more pronounced economic downturn, if it were to occur, probably hasn’t been factored in by investors. But would the Fed blink in the face of a recession? Powell side-stepped the question.

Another series of unusually large rate hikes may not be priced in either. The same can be said of an even faster rate of inflation.

Yet, no one rings a bell when the market hits bottom. Instead, investors attempt to sniff out better news before it reaches the headlines. That helps describe what we saw last month.

If you have questions or would like to talk, we are only a phone call or email away.

7300 Wealth Connect – July 2022

Shifting Fundamentals

Stocks during the first half of the year turned in their worst performances since 1970, according to CNBC. In part, it’s a timing issue since the broad-based S&P 500 Index peaked just after the year began. But that doesn’t ease the uncertainty that has fueled the decline.

Let’s back up for a moment. During the 2010s, the economic fundamentals were supportive of stocks: modest economic growth, rising corporate profits, low interest rates, and low inflation. When the Federal Reserve began hiking interest rates, the pace was gradual.

Rate hikes were gradual because economic growth wasn’t particularly fast, and inflation wasn’t a problem. In fact, the Fed fretted over its inability to get inflation up to its 2% target. In retrospect, call it a high-class problem.

It’s not that we didn’t see pullbacks. We did. Stocks never move up in a straight line, and corrections, when they occur, come unexpectedly. Nonetheless, favorable economic fundamentals reasserted, and the broad market indexes trended higher over the decade.

Today, the economic fundamentals have shifted.

These include surging inflation, aggressive Fed rate hikes, Russia’s ongoing war and its impact on oil and certain commodities, and recent Covid lockdowns in China—all which are helping raise fears of a recession.

As Figure 1 illustrates, inflation is at a 40-year high, and we have yet to see significant signs that inflation is slowing.

In response to stubbornly high inflation, the Fed shifted away from its super easy money policy last year. Today, it’s talking tough, playing catchup, and forcefully raising interest rates in order to wring inflation out of the system.

In June, the Fed lifted the fed funds rate by 75 basis points (bp, 1 bp =0.01%) to a range of 1.50–1.75%. It was the first 75 bp rate increase since 1994—see Figure 2.

Still, the aggressive path and factors outside its control have reduced the odds the Fed can engineer a soft landing—a slowdown in inflation that doesn’t trigger a recession.

Fed Chief Powell acknowledged near the end of June, “It has gotten harder. The pathways (to avoid a recession) have gotten narrower.” Such uncertainty has pressured stocks since a recession would hamper corporate earnings.

Figure 2 highlights the path of the fed funds rate over the last 30 years. Former Fed Chief Alan Greenspan preemptively raised rates in 1994—300 bp in one year—to stave off inflation.

Though unemployment was high, double-digit inflation of the 1970s and early 1980s was still uppermost on the minds of Fed policymakers.

During the early 2000s, “measured (his word of choice)” rate increases amounted to seventeen 25 bp rate hikes. During the late 2010s, Powell gradually lifted the fed funds rate.

In prior rate-hike cycles, increases were preemptive. Today, the Fed is reacting to high inflation. And the Fed believes another 50 or 75 bp is probably appropriate at its upcoming July meeting.

Note in Figure 1 that inflation peaked and slowed during and after a recession.

Why? Consumer demand falls, which makes it more difficult to raise prices. Additionally, the jobless rate rises, and wage growth slows. Smaller wage increases put less pressure on prices.

However, let’s state the obvious. Triggering a recession to stifle inflation is not ideal.

Today, a recession is a risk but not a foregone conclusion. Some leading economic indicators such as housing sales and consumer confidence have turned lower. But job openings are high, layoffs remain low, job growth is strong, and plenty of stimulus cash remains in the bank.

Perspective

The first half of the year is the worst start since 1970. However, perspective is in order. Since 1957, the S&P 500 Index has averaged a 20% or greater decline over a six-month period roughly every five years, per CNBC.

And there have been five periods when the broad-based index lost more than 30% over six months. In every instance, stocks eventually recovered.

If you have questions or would like to talk, we are only a phone call or email away.

7300 Wealth Connect – June 2022

Bearing Down

Stocks are teetering on the edge of a bear market but have yet to officially slip into a bear market. So, what is a bear market? Most analysts define a bear market as a 20% or greater decline in a major market index.

The tech-heavy Nasdaq Composite has lost nearly 30% from its November closing high to its latest bottom in late May (Yahoo Finance). But the Nasdaq and the better-known Dow Jones Industrial Average, which is off 15.1% peak-to-trough, are usually not considered arbiters.

Instead, the S&P 500 Index is generally considered the benchmark for bear markets.

On an intra-day basis, the S&P 500 briefly pierced the 20% barrier late last month, according to the Wall Street Journal, but the index has yet to close below 20%.

From its closing peak of 4,796.56 on January 3, the S&P 500’s most recent closing bottom of 3,900.79 on May 19 translates into a peak-to-trough loss of 18.68%.

While bear markets can be unsettling (and let’s remember, we have yet to officially enter a bear market), the duration has typically been shorter than bull markets.

The Schwab Center for Financial Research reviewed S&P 500 data going back to 1966. It found that the average bear market lasted 446 days (including weekends/holidays), with an average decline of 38.4%.

Bull markets, however, averaged 2,069 days and returned an average of 209.2%.

Figure 1 highlights that since the mid-1960s, bear markets have centered around recessions.

Except for the 1987 one-day market crash, we must go back to the mild bear market of 1966, when the S&P 500 shed 22% amid a sharp slowdown in economic growth. But a recession was avoided.

Notably, the S&P 500 lost nearly 20% during 1976-1978, 1998, 2011, and 2018, but avoided a bear market. The economy failed to slip into a recession during those periods.

Let’s look at a few more statistics. LPL Research reviewed data going back to the end of WWII.

It found that the S&P 500 Index lost an average of 32.7% during 13 bear markets, with the average bear market lasting 12.8 months. If we slide into a bear market, its start date will be pegged at January 3.

This year’s volatility

For starters, we can blame market weakness on high inflation and the Federal Reserve.

The Fed has responded to high inflation via a much more aggressive response than past ratehike cycles.

Last year, the Fed kept its super easy monetary policy in place far too long, forcing it to play catchup.

We can also point to Russia’s invasion of Ukraine, which has pushed the price of oil above $100 per barrel, new supply chain disruptions from draconian Covid lockdowns in China, and some fears that the economy may slip into a recession later in the year or early next year.

No one knows when we may bottom or if the market has already put in a bottom. Yet, there is no shortage of opinions from market ‘gurus’ and ‘talking heads.’

Historically, on average market pullbacks have not been as deep and as long when a recession was avoided.

We also know that time in the market, not the attempt to time the market, has been the better path to one’s financial goals.

To paraphrase one financial journalist, the hall of fame for market timers is a very lonely club.

Warren Buffett once said, “I never have the faintest idea what the stock market is going to do in the next six months, or the next year, or the next two.” His track record speaks volumes.

What do we typically see at a market bottom? There is no shortage of negative chatter.

Yes, negative sentiment abounds today: high inflation, rising interest rates, and more. But a turnaround in stocks usually occurs before bad news subsides.

As the long-term data suggest, market pullbacks eventually end, and stocks move higher. Why? The U.S. economy has expanded over a long period, and a well-diversified portfolio has tapped into that long-term economic growth.

7300 Wealth Connect – May 2022

Interest Rates, Interest Rates, and Interest Rates

Talk of a steep series of rate hikes, persistently high inflation, recent recession worries, Covid lockdowns in China, and the backdrop of the war in Ukraine created stiff headwinds for stocks in April.

Minus the war and lockdowns in China, the overriding themes since the beginning of the year have been inflation and how the Federal Reserve might react to inflation. During April, most Fed officials pulled few punches, and investor sentiment reflected the sour mood.

Let’s review the table below. Stocks had a tough month as bond yields jumped. Furthermore, yields are up sharply since the beginning of the year. Without diving into a mind-numbing discussion of discounted cash flows, higher rates compete with stocks for an investor’s dollar.

Last year, yields held at stubbornly low levels, despite high inflation. This year, the aggressive stance from Fed officials has moved the needle on bonds.

Let’s look at a couple of remarks last month. “It is of paramount importance to get inflation down,” Fed Vice Chair Lael Brainard said in an early April speech (Wall Street Journal).

“Paramount” is a strong word. It wasn’t an off-the-cuff comment. It came in prepared remarks. Since she had been considered more dovish (reluctant to aggressively raise interest rates to slow inflation), her comments suggested other dovish members are on board.

San Francisco Fed President Mary Daly said high inflation “is as harmful as not having a job… If you don’t have the confidence (the Fed will use its inflation-fighting tools), let me give it to you (CNBC).”

What is the Fed trying to communicate? Well, Fed officials don’t want to surprise investors, especially if it involves rate increases. It’s better to hint at any pain rather than surprise with shock and awe.

One closely followed measure from the CME Group suggests a 50 bp (basis point, 1 bp =0.01%) rate hike at the May 4th meeting is all but guaranteed. There is also a high probability May’s increase could be followed by 75 bp in mid-June, and another 50 bp in July.

While there are no guarantees as economic conditions could change, such a path would put the fed funds rate at 2.00-2.25% after the July meeting, up from 0.25—0.50% today.

It’s a magnitude of rate hikes we haven’t seen since 1994—see Figure 1, which is a repeat of last month’s graph.

In the 2000s, the Fed’s tone was more measured: a series of 25 bp rate hikes over two years, as it ‘pre-emptively’ moved against inflation. It was even more gradual in the 2010s. Today, the Fed is ‘reacting’ to inflation, hoping to atone for last year’s mistake, since it mistakenly believed inflation was temporary.

However, better-than-expected first quarter profits, according to Refinitiv, helped shield investors from even more volatility. Plus, most economic gauges point to economic growth.

For instances, if the economy were slowing significantly, we would see it in an uptick in layoffs. First-time claims for unemployment insurance are near the lowest since the late 1960s. As Figure 2 illustrates, continuing claims, which measures the number of individuals who receive regular benefits, is at the lowest reading in over 50 years.

If those folks were struggling to find work, claims would be rising.

Besides, anecdotal reports from various companies, including restaurants, travel, and entertainment, suggest the consumer is healthy.

For example, an April 23rd story in the Wall Street Journal:

Concert ticket prices soar on strong demand, not just inflation—Strong fan interest in better seats and experiences prompts more aggressive pricing at box office

Consumers would be far more reluctant to shell out the big bucks if they weren’t feeling good about their finances. Recent GDP data from the U.S. BEA confirms strong spending on services, though we are seeing a modest shift away from goods.

While wages aren’t keeping up with inflation, some stimulus money is still socked away in savings accounts, which is aiding spending.

But higher interest rates and incomes that aren’t keeping up with inflation could eventually lead to greater resistance. We are not there yet, as the Federal Reserve hopes to slow inflation without leading the economy into a recession.

It will require skill and a little bit of luck.

The recent rise in the dollar could help slow inflation for imported goods. Next, help with the supply chain would be welcome. If you have questions or would like to talk, we are only a phone call away.

7300 Wealth Connect – April 2022

Resilience

The Dow Jones Industrial Average is down 5.8% since its January 4th record high and the broader-based S&P 500 Index is off 5.5% since its January 3rd record high, according to St. Louis Federal Reserve market data through March 31.

If we measure the respective peaks to the most recent troughs of both indexes, the Dow lost 11.3% (January 4—March 8) and the S&P 500 Index lost 13.0% (January 3—March 8).

Selloffs are inevitable, and losing ground is hardly a reason to get excited, even if the recent pullback is modest.

Yet, given the Russian invasion of Ukraine, high inflation, soaring oil/gas prices, and rising rates from the Federal Reserve, stocks have been resilient in the face of stiff headwinds.

The most immediate impact of the war has been on gasoline prices, as illustrated by Figure 1.

The jump in gasoline prices will have an immediate impact on inflation, and we’ll see it reflected in the March Consumer Price Index, when it is released in mid-April.

But the overall economic impact is less certain. For every penny increase in the price of gas, U.S. consumer spending drops by $1.18 billion a year, according to an estimate from Federated Global Investment Management (Bloomberg).

For example, a $0.75 jump in gasoline, if maintained over a year, would hit spending by roughly $90 billion. But U.S. Gross Domestic Product is over $24 trillion, which would translate to less than 0.4%. It’s not insignificant, but by itself, it’s not enough to throw the economy into a recession.

Still, it’s not simply gasoline prices that are rising, and we may see some resistance to higher prices in general.

For investors, war generated an enormous amount of uncertainty, and stocks lost ground in the wake of the invasion. Yet, fighting continues and stocks have moved off the early March low.

Ukraine is far from an ideal situation, and how the war may unfold is a big unknown. But recently, there have been no significant developments that might negatively affect investor sentiment, and investors seem to be taking the apparent stalemate in stride.

Put another way, investors have gradually adapted to a new normal.

It’s not that we are immune to wanton acts of aggression by Russia. We’re not. Investors view geopolitical events through a very narrow prism. That is, how it may affect economic growth.

During March, economic activity appeared to accelerate. Weekly first-time claims for jobless benefits fell to a 52-year low per the Dept of Labor, and the U.S. BLS reported 431,00 new jobs.

The Federal Reserve rediscovers its purpose

We haven’t seen a truly aggressive rate-hike cycle since 1994, when the Fed lifted the fed funds rate from 3% to 6% in one year—see Figure 2.

The last time we saw a 50 basis point ( 1 bp = 0.01%, so 50 basis points in this example = 0.50%) rate increase was in 2000.

As illustrated in Figure 2, the Fed raised the fed funds rate last month by 25 bp to a range of 0.25—0.50%.

The Fed’s Summary of Economic Projections released in March suggests the fed funds rate could rise to 1.75—2.00% by the end of the year. One closely followed gauge from the CME Group suggests a fed funds rate of 2.50—2.75% is possible by year-end.

Of course, these are simply projections and measures of sentiment at a point in time. They are based on the aggressive tone taken by Fed Chief Powell, recent comments by Fed officials, today’s tight labor market, and high inflation.

The Fed’s goal is to slow overall economic demand, which is putting upward pressure on prices, and reduce the huge number of job openings, which puts upward pressure on wages. Both variables raise costs for businesses, which can get added to the price of retail goods.

Few would turn down a big raise. That’s understandable. But the Fed sees a wage-price spiral and too-strong demand as inflationary.

Of course, to bring down inflation, the Fed will need help from the supply chain, but the war in Ukraine will likely exacerbate problems, at least over the shorter term.

During the mid-1960s, mid-1980s, and mid-1990s, the Fed pre-emptively acted against the potential of higher inflation and engineered what analysts call a ‘soft landing,’ which simply means it didn’t throw the economy into a recession.

Today, the economy is creating plenty of jobs, but inflation is higher, which makes the Fed’s task more challenging.

Why is it more challenging? High inflation will likely require more aggressive rate increases, which might slow the economy too quickly.

The Fed is not acting proactively against the possibility of higher inflation. Instead, it is reacting to higher prices, hoping to bring inflation back to its 2% target without a recession, i.e., a hard landing.